Arduino Data Logging: Excel Integration Guide

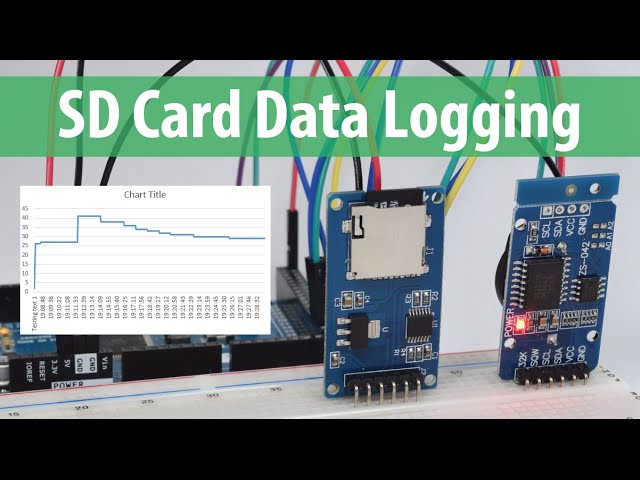
Welcome to our comprehensive guide on integrating Arduino with Microsoft Excel for data logging. This tutorial is designed for beginners and hobbyists keen on learning how to collect, store, and analyze data from Arduino projects using one of the most popular data analysis tools available—Excel. By the end of this guide, you'll be able to set up an automatic data logging system, understand how to export data from Arduino to Excel, and make the most out of your Arduino projects with precise data management.
Why Integrate Arduino with Excel?

Integrating Arduino with Excel opens up numerous possibilities for data visualization and analysis. Here’s why you might want to consider this:
- Data Logging: Automatically record sensor data over time, which can be crucial for long-term projects or experiments.
- Real-time Analysis: Monitor your Arduino projects in real-time via Excel, allowing for immediate analysis and reaction to data changes.
- Historical Data Analysis: Keeping historical data in Excel enables you to perform statistical analyses, create charts, and understand trends over time.
Setting Up Your Arduino for Data Logging

Before you start integrating with Excel, you need to set up your Arduino for data logging:
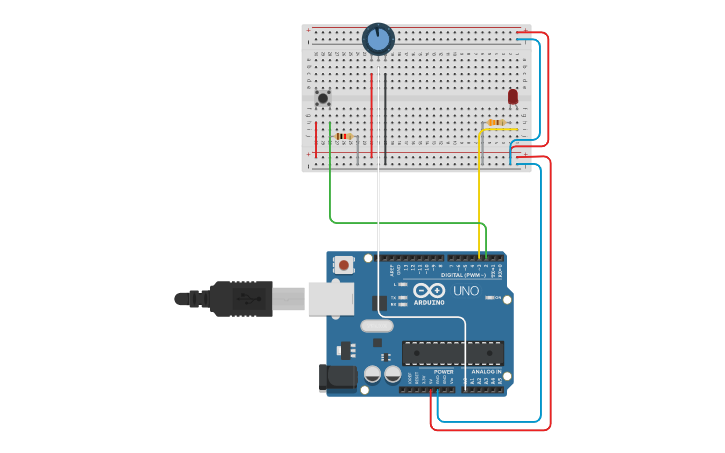
- Hardware Setup: Ensure your Arduino board is connected to the sensors you want to log data from. Use an Arduino Uno, Mega, or any compatible board.
- Arduino IDE: Install the Arduino IDE on your computer if you haven’t already, and familiarize yourself with basic Arduino programming.
- Serial Communication: Configure your Arduino to communicate through the Serial Monitor for logging data.
Here's a simple Arduino sketch to get you started with reading from a temperature sensor:
#include
#include

#define ONE_WIRE_BUS 2

OneWire oneWire(ONE_WIRE_BUS);
DallasTemperature sensors(&oneWire);

void setup(void) {
  Serial.begin(9600);
  sensors.begin();
}

void loop(void) {
  sensors.requestTemperatures();
  float tempC = sensors.getTempCByIndex(0);

  // Log Temperature to Serial Monitor
  Serial.print("Temperature: ");
  Serial.print(tempC);
  Serial.println("ºC");

  delay(1000); // Wait for 1 second before next reading
}
After setting up your Arduino, follow these steps to log data:
- Connect your Arduino to your computer using a USB cable.
- Open the Serial Monitor from the Arduino IDE to check the incoming data.
- Make sure the baud rate matches what you've set in your Arduino code (9600 in this example).
⚠️ Note: Ensure your Arduino is reading data correctly before moving on to integration with Excel.
Exporting Arduino Data to Excel

Once your Arduino is logging data, here’s how you can export it to Excel:
- Using Serial Monitor:
- Copy and paste the data manually from the Arduino Serial Monitor into an Excel sheet. This method is straightforward but not efficient for long-term logging.
- Serial Logging to Text File:
- Write the data to a text file from the Arduino IDE by redirecting the Serial Output to a file:
screen /dev/tty.usbmodem1451 9600 > output.txt - Then, import this text file into Excel.
- Write the data to a text file from the Arduino IDE by redirecting the Serial Output to a file:
- Automated Logging with Python:
- Write a Python script to automatically log Arduino data into an Excel file:
import serial from openpyxl import Workbookarduino = serial.Serial(‘/dev/cu.usbmodem1451’, 9600, timeout=1) wb = Workbook() ws = wb.active
while True: if arduino.in_waiting > 0: data = arduino.readline().decode(‘utf-8’).strip() print(data) ws.append([data]) wb.save(‘arduino_log.xlsx’)
Analyzing Arduino Data in Excel

After exporting your data to Excel, here are some ways to analyze it:
- Create Charts: Use Excel’s charting tools to visualize trends, for instance, a temperature vs. time chart.
- Statistical Analysis: Perform average, median, standard deviation, and other statistical functions on your data.
- Conditional Formatting: Highlight cells based on conditions like temperature thresholds.
- Data Filtering: Filter out unnecessary data to focus on specific trends or anomalies.
| Function | Description |
|---|---|
| =AVERAGE(B2:B100) | Calculates the average temperature recorded. |
| =MEDIAN(B2:B100) | Provides the median value of temperatures for a more robust central tendency measure. |
| =STDEV(B2:B100) | Gives the standard deviation, indicating the variability of data. |
| =MAX(B2:B100) | Find the highest temperature recorded in the dataset. |

Now that you have your data in Excel and can analyze it, let's move on to some frequently asked questions about Arduino and Excel integration:
How often should I log data from Arduino to Excel?

+
The frequency of logging depends on your project's needs. For slow-changing conditions like room temperature, logging every 10-30 minutes might be sufficient. For more dynamic processes, you might need to log data every second or even faster.
Can I automate the data transfer from Arduino to Excel?

+
Yes, with Python and libraries like openpyxl, you can automate the process. The example provided earlier in the post shows how to save Arduino serial output directly into an Excel file in real-time.
What if my Excel sheet gets too large to manage?

+
Excel has a limit on the number of rows it can handle, around 1,048,576 for Excel 2007 and later versions. If you exceed this, consider using Excel's features like Power Pivot for larger data sets, or external databases for data storage with Excel for visualization.
In this guide, we’ve explored how to integrate Arduino with Excel for data logging, explained the setup process, shown methods for data export, and provided techniques for data analysis. With these tools at your disposal, you’re now equipped to monitor, log, and analyze data from your Arduino projects efficiently. Remember, practice makes perfect, so start experimenting with your own sensors and let Excel help you make sense of the data!


