Excel Chart in New Sheet: Simple Creation Guide

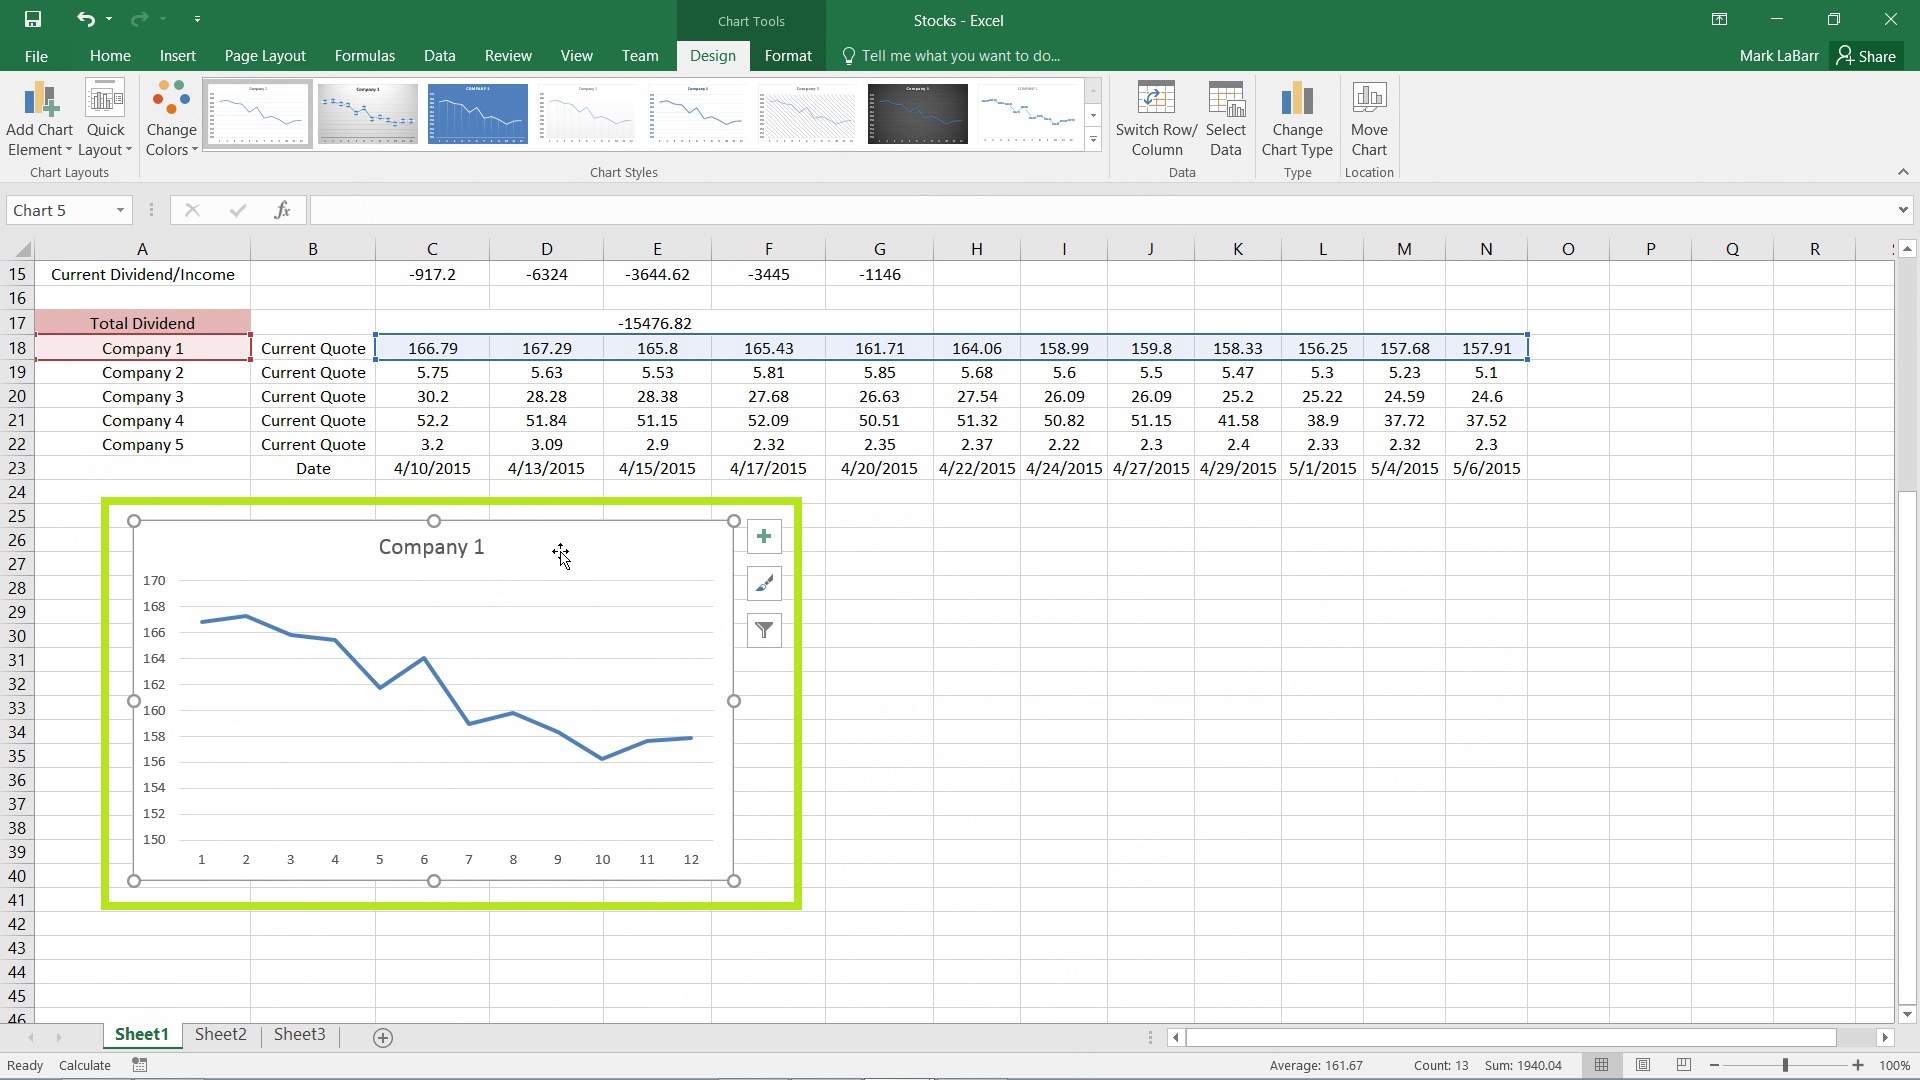
Creating charts in Microsoft Excel helps in visualizing and understanding data trends, patterns, and comparisons at a glance. Many users find the process of plotting charts somewhat confusing when trying to place them on a new worksheet, fearing they'll disrupt their existing data layout. This comprehensive guide will walk you through the straightforward process of creating an Excel chart on a new sheet, ensuring your data remains pristine while your charts stand out.
Why Chart in a New Sheet?

Before diving into the how-to, understanding the why is essential. Here are a few reasons:
- Maintains workbook organization: Your data and charts are separated, keeping your workbook tidy.
- Enhances presentation: Charts can be viewed and presented without the clutter of data.
- Prevents accidental edits: Charts on separate sheets avoid any unintended modifications to your source data.
Step-by-Step Guide to Create a Chart in a New Sheet

Step 1: Prepare Your Data

Ensure your data is organized in a way that Excel can easily interpret for charting. It should be in rows or columns, with headers, labels, and values.
Step 2: Select Your Data

Highlight the data range you want to chart. Avoid selecting empty rows or columns as they can interfere with chart creation.
Step 3: Initiate the Charting Process

Once your data is selected:
- Navigate to the Insert tab on the Ribbon.
- Choose your preferred chart type from the ‘Charts’ group.
- From the dropdown menu, select your chart type, e.g., Column, Line, Pie, etc.
- Right-click on the chart you’ve inserted into the active worksheet.
Step 4: Move Chart to a New Sheet

After inserting the chart:
- Right-click on the chart for the context menu.
- Select “Move Chart” from the options.
- In the dialog box, choose “New sheet” and name it appropriately. Then, click OK.
Step 5: Customize Your Chart

With your chart now on a new sheet, take the opportunity to refine it:
- Add chart title if you haven’t already.
- Adjust the legend, axis labels, and color schemes.
- Consider adding data labels, trendlines, or error bars for enhanced data interpretation.
Common Customizations for Better Charts

Chart Types and Their Uses

| Chart Type | Ideal for |
|---|---|
| Column Chart | Comparing values across categories |
| Line Chart | Showing trends over time |
| Pie Chart | Illustrating proportions within a whole |
| Scatter Plot | Analyzing relationships between variables |

💡 Note: Remember, the effectiveness of your chart depends on its relevance to the data being presented. Consider the story you want to tell and choose accordingly.
Final Touches

After your chart is set up:
- Review the chart on the new sheet for accuracy and readability.
- Make any last-minute tweaks to the design, like adjusting the layout or adding annotations.
By following these steps, you've now successfully created and placed your chart on a new worksheet in Excel, enhancing both your data management and presentation skills. This method not only keeps your workbook organized but also ensures your charts are ready to be presented without any interference from your data.
Can I revert a chart back to the original worksheet?

+
Yes, you can move the chart back to the original worksheet by using the “Move Chart” option again and selecting the original sheet from the list.
What if I want to update the data in my chart?

+
You can update the data by selecting the chart and then editing the data range from the “Select Data” option under the Chart Tools tab.
Do I lose any data by moving my chart to a new sheet?

+
No, moving the chart doesn’t affect your source data in any way. Excel simply provides a new, dedicated space for the chart.


