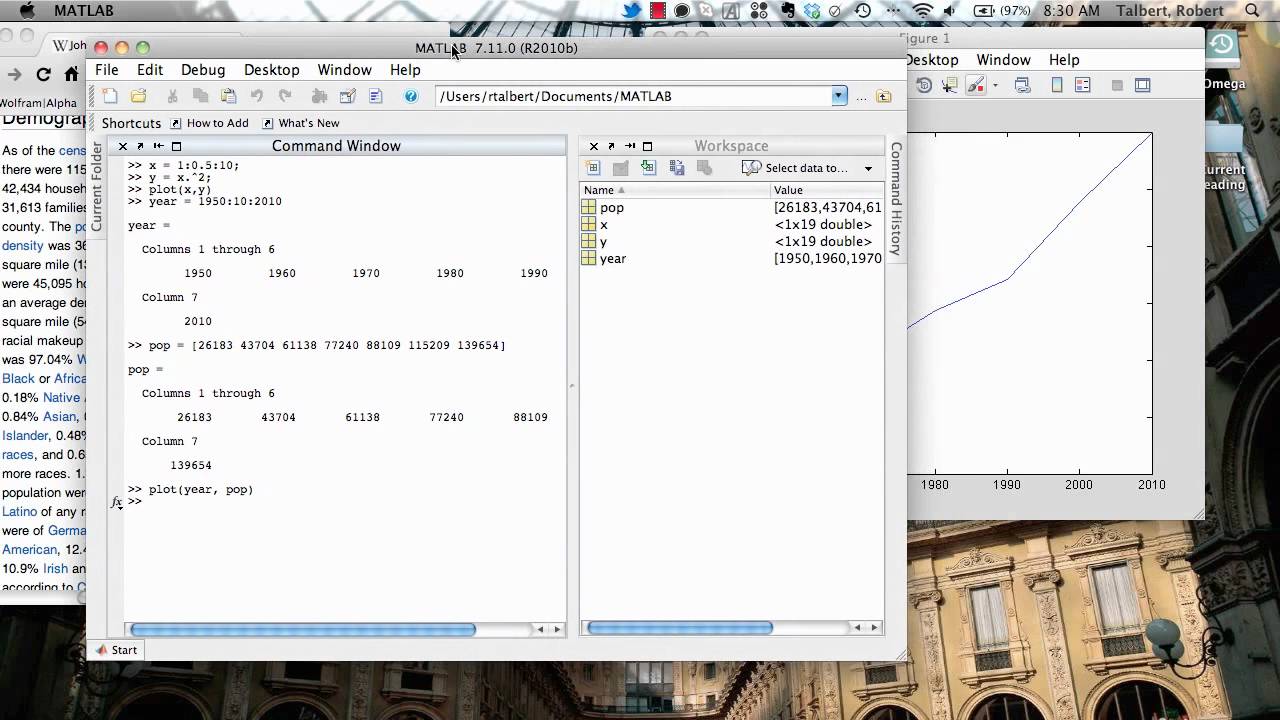
5 Ways to Plot Excel Sheets in MATLAB Easily

In the world of data analysis, Excel and MATLAB are often mentioned in the same breath. Excel's intuitive user interface and powerful data manipulation capabilities make it a go-to tool for many data analysts and scientists. However, when it comes to visualization, MATLAB's extensive plotting capabilities can significantly enhance the presentation and analysis of data. Here, we will explore five straightforward ways to plot Excel sheets in MATLAB, allowing you to leverage the strengths of both applications.
Why Combine Excel with MATLAB?

- Data Consistency: Excel is widely used for its data entry and organization capabilities, ensuring that your data is structured and ready for analysis.
- Enhanced Visualization: MATLAB provides sophisticated plotting functions that can create a wide variety of graphs with more customization options than Excel.
- Efficiency: Transferring data between Excel and MATLAB reduces the manual effort in data preprocessing and plotting.
1. Using Import Data from Excel File

MATLAB can directly import data from an Excel file with ease. Here’s how you can do it:
- Prepare Your Excel Sheet: Ensure your data is in tabular form, with headers if needed, and saved as .xlsx, .xlsm, or .xls.
- Open MATLAB: Start MATLAB and navigate to the directory containing your Excel file.
- Import Data:
- In MATLAB, go to the Home tab.
- Click on Import Data.
- Select your Excel file from the dialog box.
- MATLAB will display the data, allowing you to choose which sheet and range to import.
- Click Import Selection.
- Assign to Variable: MATLAB will automatically assign the imported data to a variable, typically named after the sheet name or a default name like `data`.
💡 Note: MATLAB's import functions can handle various Excel file formats, but older .xls files might not support all the functionalities of newer versions.
2. Read Excel File with MATLAB Function

If you prefer scripting your data import, MATLAB provides the `readtable` function:
% Importing an Excel sheet into MATLAB
data = readtable('YourExcelFileName.xlsx', 'Sheet', 'Sheet1');
- Specify Sheet: Include the sheet name or number if your Excel file has multiple sheets.
- Customize Import: You can define which ranges or columns to import by adjusting the function's parameters.
📝 Note: Ensure the Excel file path is correct, relative to your MATLAB working directory or absolute path.
3. Plotting with xlsread

The `xlsread` function is an older but still valid method for importing data:
% Importing data and plotting
[numbers, text, raw] = xlsread('YourExcelFileName.xlsx', 'Sheet1');
% Plot the first two columns
plot(numbers(:,1), numbers(:,2));
xlabel('X Axis');
ylabel('Y Axis');
title('Excel Data Plot');
🔎 Note: `xlsread` is being phased out in newer versions of MATLAB in favor of `readtable` or `readmatrix`. However, it remains useful for quick plotting with raw Excel data.
4. Customizing Plots with MATLAB

Once you have your data in MATLAB, customization options for plots are extensive:
- Color and Style: Use properties like `LineStyle`, `Color`, and `Marker` to customize your plot.
- Legends and Labels: Add legends with `legend()` and label your axes with `xlabel()`, `ylabel()`, and `title()`.
- Multiple Plots: Combine multiple plots using `hold on` and `hold off`, or `subplot` for grids of plots.
- Interactive Features: Enable zooming, panning, and data cursor modes to make your plots interactive.
🎨 Note: MATLAB allows for detailed control over plot elements, making your data visualization more compelling and communicative.
5. Saving Plots

After plotting, you might want to save your figures for reports or presentations:
% Save the figure to a PNG file
saveas(gcf, 'YourPlot.png');
Alternatively, you can save as other formats like EPS, PDF, or FIG, depending on your needs:
- Vector Graphics: Use formats like EPS or SVG for high-quality print.
- Bitmap Graphics: PNG or JPEG for digital use where resolution might not be as critical.
🖼️ Note: MATLAB can save figures in various formats, ensuring compatibility with different media and devices.
Wrapping up our exploration of plotting Excel sheets in MATLAB, we've covered several methods ranging from simple data import to detailed customization of plots. Combining Excel's data organization with MATLAB's plotting capabilities enhances your ability to analyze and present data effectively. By following these steps, you can quickly transition from raw data to insightful visualizations, making the most of both tools in your data analysis workflow.
Can I import multiple sheets from an Excel file into MATLAB?

+
Yes, you can import multiple sheets by specifying them in the readtable or xlsread functions or through the Import Data wizard. Just indicate which sheets or ranges you want to import, and MATLAB will handle the rest.
What if my Excel file contains formulas? Will MATLAB recognize them?

+
MATLAB does not evaluate Excel formulas during import. Instead, it imports the calculated values present in the cells when the file is opened. If you need to retain formula information, you must manage this separately or ensure your data is ready before importing.
Are there limitations to plotting data from Excel in MATLAB?

+
Generally, MATLAB is quite versatile, but there can be limitations if your Excel data includes complex formatting, pivot tables, or conditional formatting which MATLAB does not directly interpret. Always ensure your data is clean and ready for MATLAB analysis.


