Organize Your Data in Excel: Simple Tips for Efficiency

In today's data-driven world, managing information efficiently is not just a convenience; it's a necessity. Whether you're handling business analytics, managing project timelines, or simply tracking personal finances, Microsoft Excel offers a robust suite of tools to streamline your work. Here, we'll explore some simple yet effective tips to organize your data in Excel, ensuring both productivity and accuracy in your work.
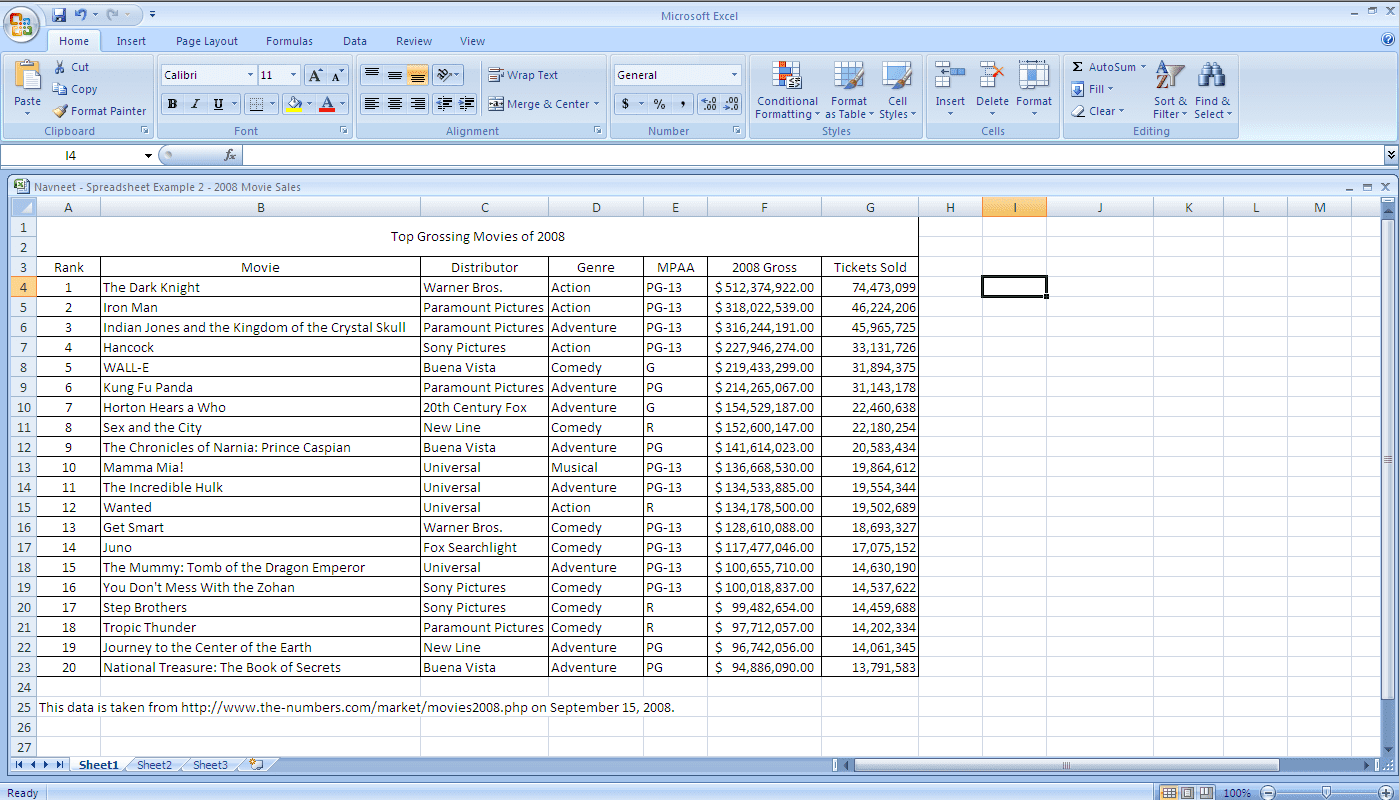
Understanding Excel’s Grid Layout


Before diving into tips, it’s crucial to understand how Excel’s grid works:
- Columns are labeled with letters (A, B, C, …, Z, AA, AB…).
- Rows are labeled with numbers (1, 2, 3, …).
- The intersection of a column and a row gives you a cell with a unique address, like A1 or B3.
Mastering this basic structure sets the foundation for using Excel effectively.
Freeze Panes for Easy Data Navigation

When working with large datasets, it’s common to lose track of what headers correspond to which columns or rows. Use the Freeze Panes feature to:
- Keep headers visible while scrolling through data.
- Lock specific rows or columns in place to maintain context.
To freeze panes:
- Select the row below the rows you want to freeze.
- Go to the ‘View’ tab.
- Click on ‘Freeze Panes’ and choose ‘Freeze Top Row’ or ‘Freeze First Column’ as needed.
📌 Note: You can freeze both rows and columns at the same time by selecting the cell below and to the right of the area you want to keep in place.
Sorting and Filtering Data

Data can quickly become disorganized without regular maintenance. Here’s how to use Excel’s sorting and filtering capabilities:
- Sort: Click anywhere in your dataset, go to ‘Data’ > ‘Sort & Filter’ > ‘Sort’ to arrange data in ascending or descending order by column.
- Filter: Click on the filter icon to show only the data you need to see. This is particularly useful when dealing with large tables where you need to analyze specific subsets.
Conditional Formatting for Insightful Views


Excel’s conditional formatting can visually highlight important data points:
- Select the cells you want to format.
- Go to ‘Home’ > ‘Conditional Formatting’.
- Choose from options like ‘Highlight Cell Rules’, ‘Data Bars’, or ‘Color Scales’ to visually represent your data.
This feature helps in identifying trends, anomalies, or critical thresholds at a glance.
Use of Tables for Structured Data

Converting your data range into a table offers several benefits:
- Auto-filtering
- Structured references (easier formula management)
- Auto-expansion of data as you add more
| Column Header 1 | Column Header 2 | Column Header 3 |
|---|---|---|
| Data | Data | Data |
| Data | Data | Data |

To create a table:
- Select your data range.
- Go to ‘Insert’ > ‘Table’.
- Ensure the ‘My table has headers’ checkbox is checked.
🔍 Note: Excel tables automatically add new rows at the bottom when you enter data, making data entry seamless.
Data Validation for Error Reduction

To avoid errors in data entry:
- Data Validation: Set rules for what can be entered into a cell.
- Go to ‘Data’ > ‘Data Validation’.
- Choose settings like ‘Whole Number’, ‘Date’, or ‘Custom’ to restrict data input.
- Dropdown Lists: Create lists for controlled data entry.
In wrapping up, organizing your data in Excel doesn’t just make your work look tidier; it significantly enhances your efficiency, reduces errors, and allows for more meaningful data analysis. From the grid layout to advanced features like conditional formatting and data validation, each tool plays a pivotal role in managing data effectively. Regular use of these tips will not only make your work easier but also more insightful as you leverage Excel to its full potential.
Why should I use Excel tables for my data?

+
Excel tables provide structured references, automatic filtering, and expandable data ranges, making data management seamless and more efficient.
How can I ensure my data in Excel is error-free?

+
Utilize data validation rules and dropdown lists to control what types of data can be entered into cells, thus minimizing errors.
What’s the benefit of conditional formatting in Excel?

+
Conditional formatting visually highlights specific data points based on your criteria, making it easier to analyze trends, identify outliers, and quickly understand data at a glance.


