Master Excel Sheets: Step-by-Step Operation Guide

The world of data organization and analysis is ever-evolving, and Excel remains a cornerstone tool for professionals across various industries. Whether you're a business analyst, an accountant, or just someone who loves data, mastering Excel can significantly enhance your productivity and decision-making capabilities. Here's a step-by-step guide to help you navigate and excel in Excel sheets.
Starting with the Basics
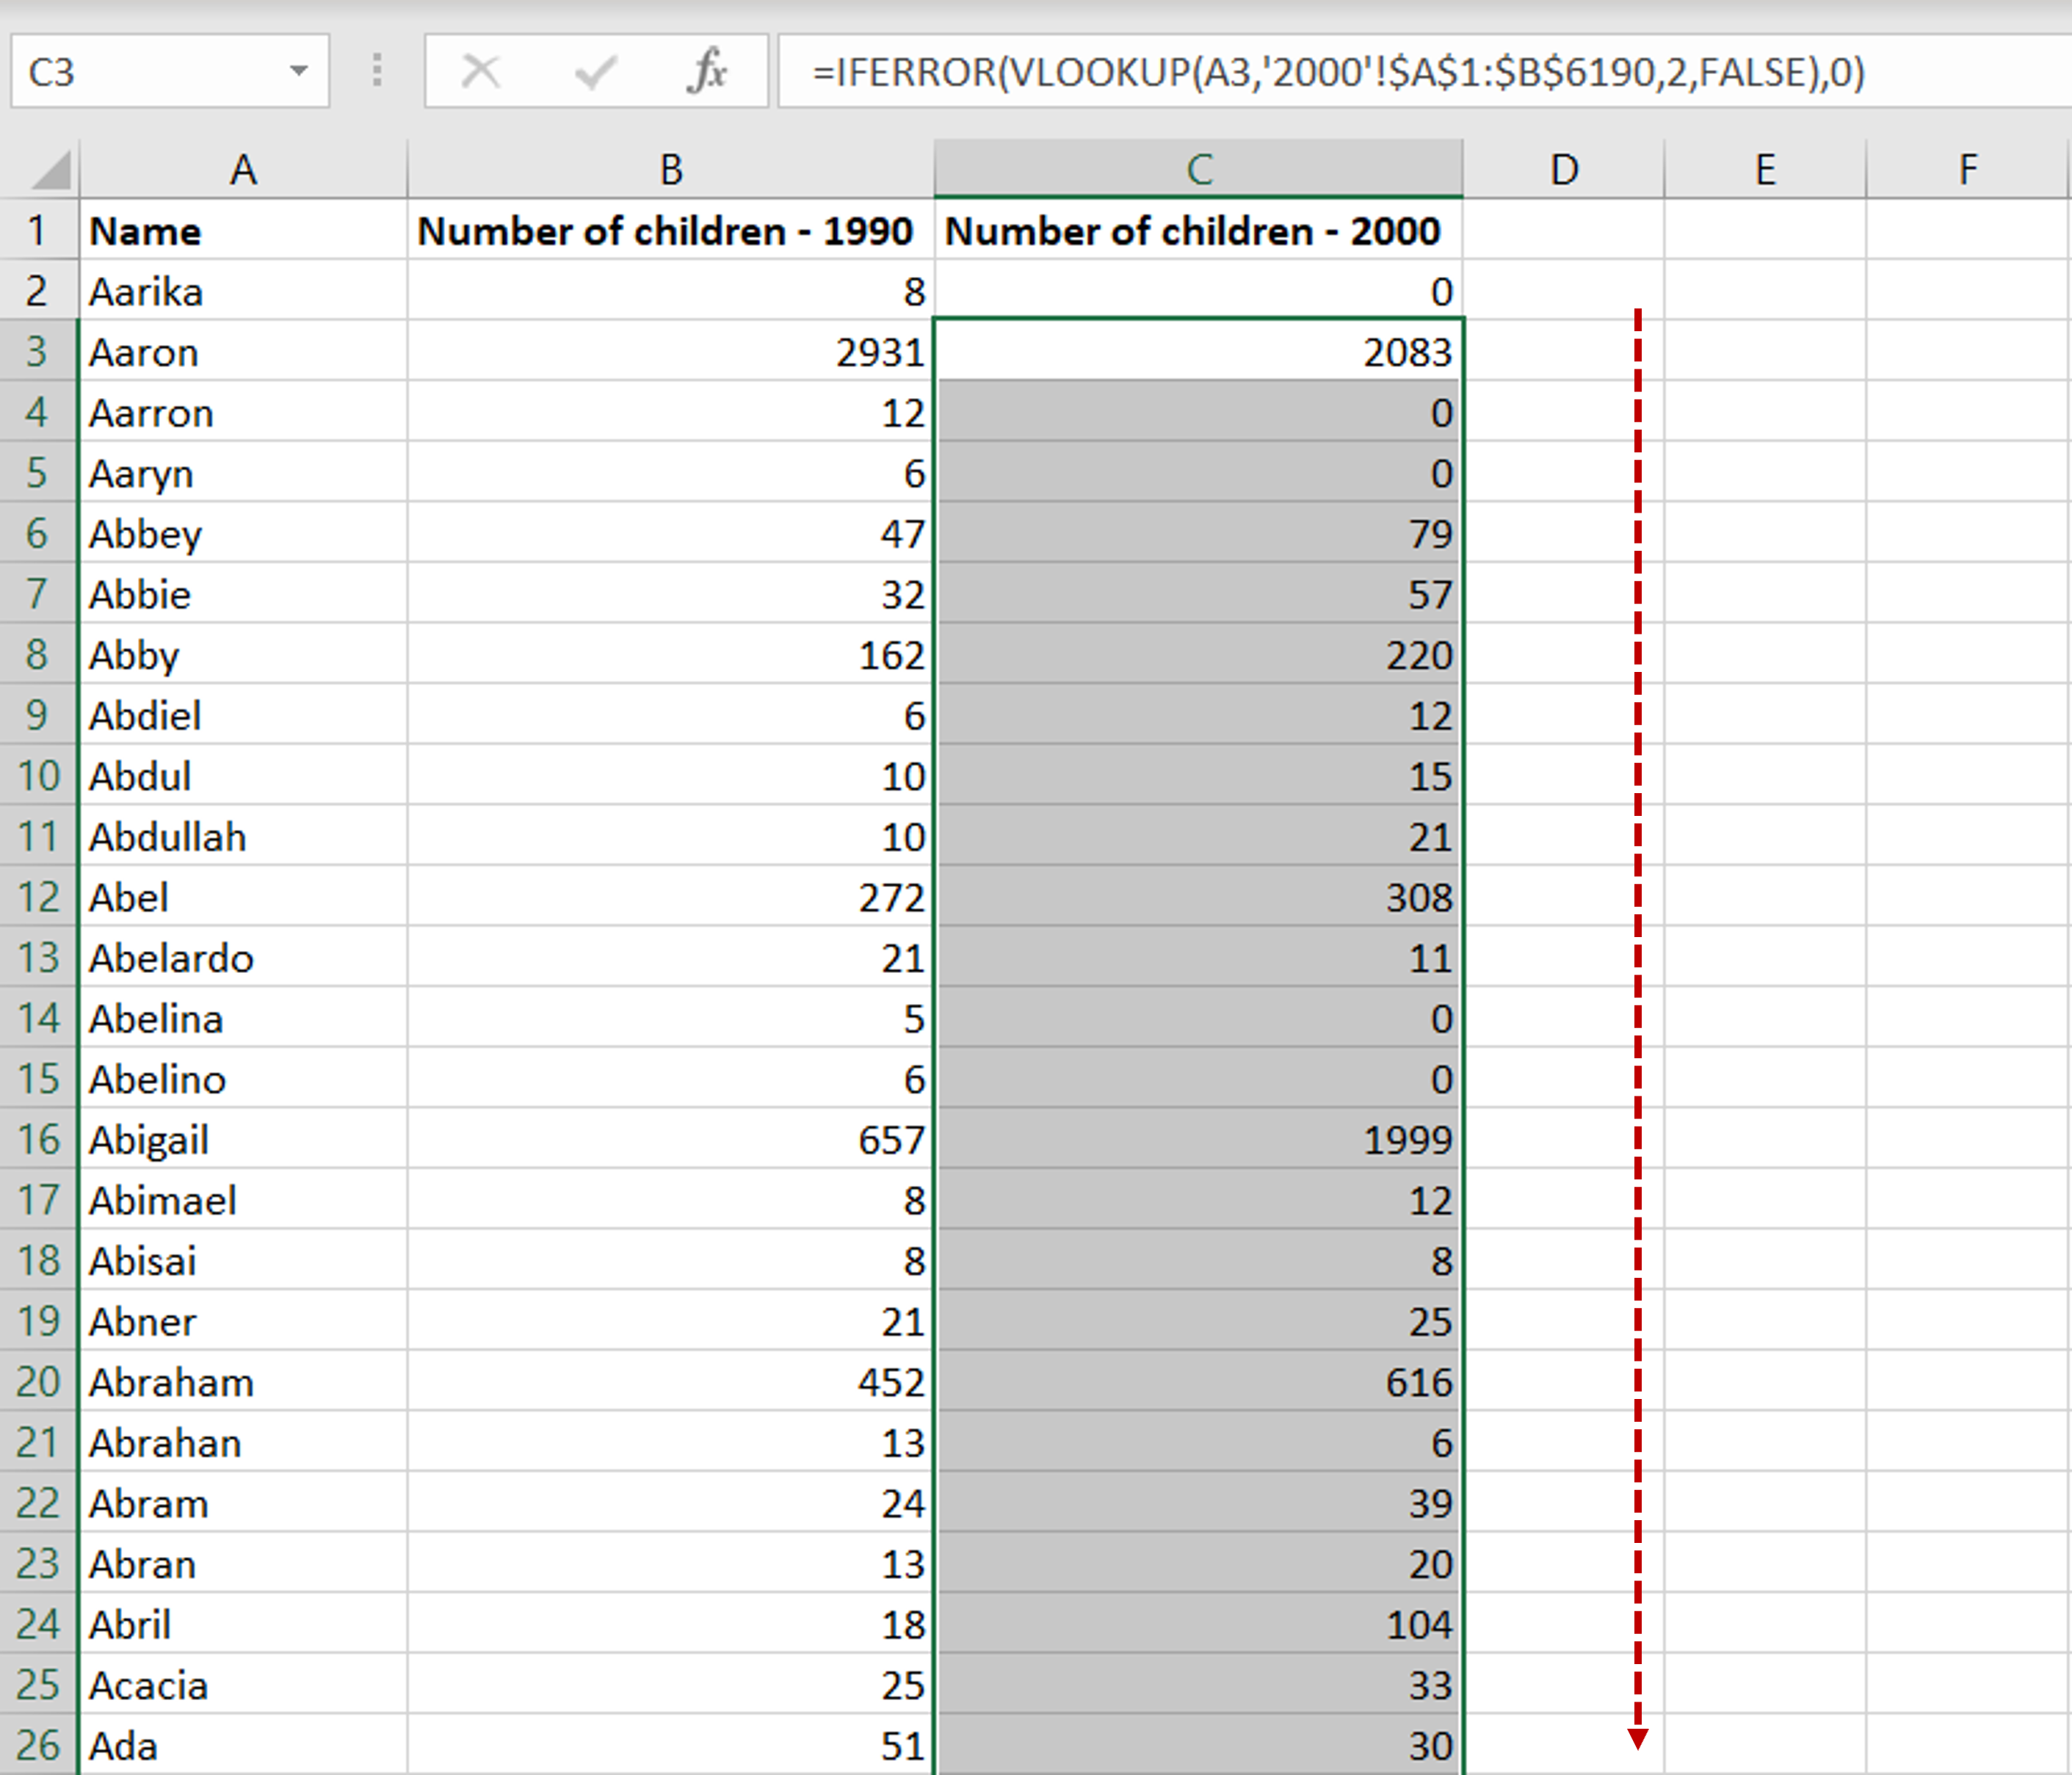

Before diving into complex operations, it’s vital to understand Excel’s basic interface:
- Workbook - The entire Excel file, containing multiple sheets.
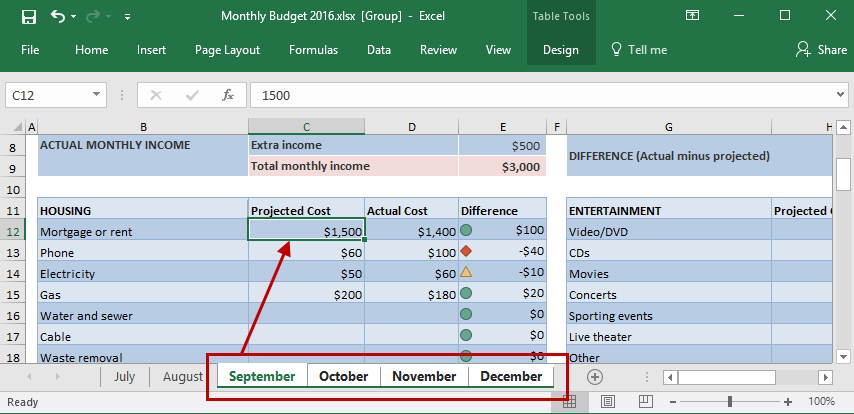
- Sheet - Each tab within the workbook, where your actual data resides.
- Cell - The intersection of a column and row, where data is entered.
- Formulas - Expressions for calculations, like SUM or AVERAGE.
- Functions - Predefined operations to perform complex tasks.
Navigating Your Worksheet

- Use the arrows or
Ctrl + Arrowsto move around quickly. - Navigate to the end of a data range with
Ctrl + Arrow Key. - Select columns or rows with
Ctrl + SpaceorShift + Space.
Entering and Editing Data
Entering data in Excel is straightforward:
- Click a cell and type your data.
- Use
F2or double-click to edit cell contents. - Auto-fill patterns by dragging the fill handle (small square at the bottom right of the cell) down or across cells.
Formulas and Functions

The power of Excel lies in its formulas and functions:
- Basic Operations: Use
=SUM(A1:A10)to sum cells from A1 to A10,=AVERAGE(B1:B10)for average calculations, and=MAX(C1:C10)or=MIN(C1:C10)for maximum and minimum values. - Logical Functions: Functions like
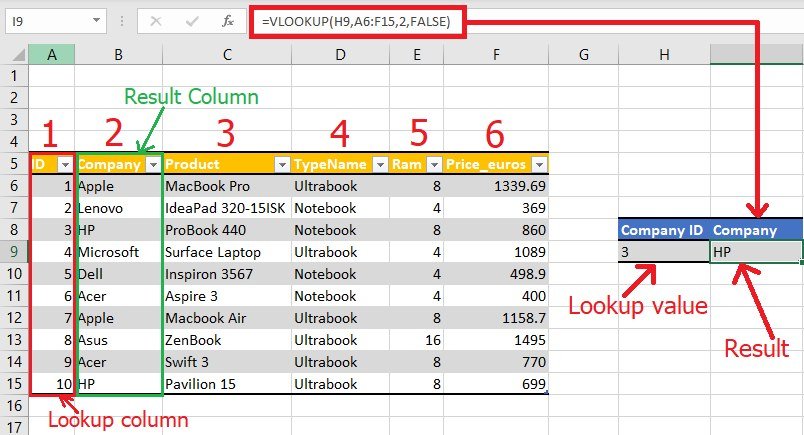
IF(), AND(), OR()for conditional checks. - Lookup and Reference: Utilize
VLOOKUP(), HLOOKUP(), INDEX(), MATCH()to retrieve data from large datasets.
📝 Note: To ensure your formulas work correctly, always include the necessary parentheses to define the order of operations, especially with nested functions.
Data Formatting and Styles

Excel’s formatting options help in making your data visually appealing:
- Use the
Hometab for basic formatting like font, color, and alignment. - Apply conditional formatting to highlight cells based on specific criteria.
- Create custom formats for specialized data like dates, times, or currency.
| Shortcut | Description |
|---|---|
Ctrl + 1 |
Opens the Format Cells dialog |
Ctrl + Shift + $ |
Applies currency format |
Ctrl + Shift + # |
Formats cells as a date |
Filtering and Sorting

- Filtering: Click the filter icon in the header row to view or sort data.
- Sorting: Arrange data by clicking the headers or using the Sort & Filter option.
- Custom Sorts: Define custom sorting criteria for unique data sets.
Charting Your Data
Visual representation of data can be powerful:
- Select your data range and click
Insertto add charts like Column, Pie, Line, etc. - Customize chart elements, colors, and styles for better data representation.
Using Excel’s Analysis Tools

- PivotTables: Summarize large datasets by dragging fields into rows, columns, and values.
- What-If Analysis: Utilize Goal Seek and Data Tables to perform complex calculations.
⚠️ Note: Ensure your data is clean and well-organized before using analysis tools; otherwise, the results might be misleading.
Excel Macros

For repetitive tasks, macros can automate your work:
- Use the
Record Macrofeature to capture steps you perform manually. - Write VBA (Visual Basic for Applications) scripts for more advanced automation.
As you navigate through Excel's functionalities, from basic data entry to complex data analysis, remember that practice is key to mastery. Each feature unlocks a new layer of possibilities, enhancing your ability to manage, analyze, and present data effectively.
Excel's versatility means there's always something new to learn, from advanced formulas to custom data analysis tools. Leverage these capabilities to streamline your workflow, make informed decisions, and present data in a visually compelling manner.
What are the most useful Excel shortcuts?
+
Some useful shortcuts include: Ctrl + C for copy, Ctrl + V for paste, Ctrl + Z for undo, and Ctrl + Home to jump to the top of the worksheet.
How can I quickly navigate to a specific cell in Excel?

+
Press Ctrl + G or F5 to open the ‘Go To’ dialog, where you can enter the cell address you want to navigate to.
Can Excel perform complex statistical analysis?

+
Yes, Excel has various statistical functions like AVERAGE(), STDEV(), CORREL(), T.TEST() and more, plus the Analysis ToolPak add-in for advanced statistical analysis.


