Move Your Excel Charts to a New Sheet Easily

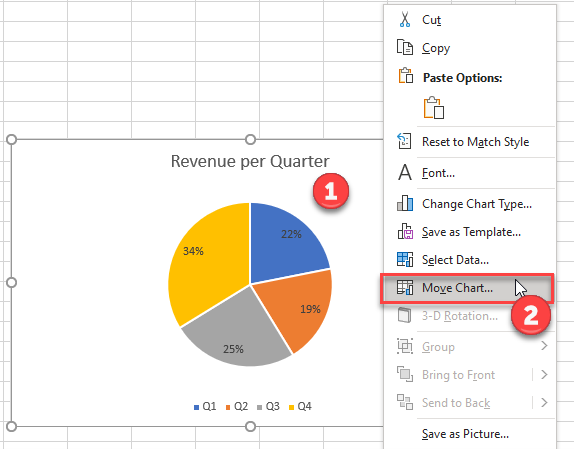
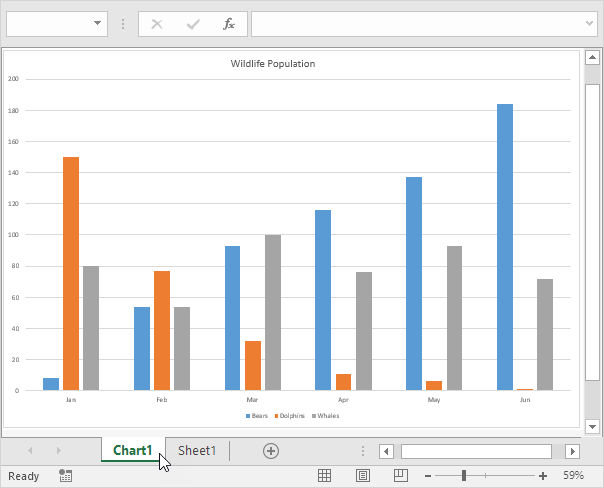
Need to organize your Excel charts better? Moving charts to separate sheets can significantly enhance the readability and professional presentation of your spreadsheets. Whether you're preparing a financial report, analyzing data trends, or creating a dashboard, having your charts on dedicated sheets is a smart move. Let's walk through the straightforward steps to move your charts to new sheets in Microsoft Excel.
Step-by-Step Guide to Moving Charts

1. Select Your Chart

To begin moving your chart:
- Click anywhere on the chart you wish to move. A border around the chart signifies it’s selected.
- If your chart overlaps with data, selecting the chart might be tricky. Try clicking on the chart’s border or any blank space within the chart area.
2. Copy the Chart

Now that your chart is selected:
- Press Ctrl+C on your keyboard or navigate to the Home tab and click Copy to duplicate the chart.
3. Create a New Sheet

With your chart copied:
- Right-click any tab at the bottom of your Excel window.
- Choose Insert from the context menu to add a new worksheet.
Once the new sheet is created:
- Rename it to something relevant, like ‘Charts’, ‘Summary’, or the specific chart’s title.
4. Paste the Chart into the New Sheet

Now, in the newly created sheet:
- Select cell A1 (or any preferred location).
- Press Ctrl+V or click on Paste from the Home tab to paste the chart.
⚠️ Note: Ensure the chart fits within the cell area you’ve selected. Adjust if necessary by resizing the chart.
5. Modify the Chart as Needed

Once pasted, you can:
- Alter the chart’s size or style to fit the new context.
- Adjust the legend, axis labels, or data sources to better suit the presentation.
6. Link Your Chart to Original Data

If your chart uses external data:
- Make sure the data source for your chart is still linked to the original sheet.
- If the link breaks, your chart might not update as data changes. Verify the Chart Data Range from the Chart Tools > Design tab.
💡 Note: To keep your workbook organized, consider linking charts to named ranges or using Excel tables for your data.
Why Move Charts to New Sheets?

There are several reasons to keep your charts separate:
- Clutter Reduction: Keep your data sheets clean and focused.
- Enhanced Clarity: Present charts in a dedicated space, making it easier for viewers to understand the visual representations.
- Professional Presentation: A well-organized workbook looks more professional and is easier to navigate.
- Data Analysis: Separate sheets allow for better focus on data trends or anomalies without the visual distraction of charts.
By following these steps, you can easily manage your charts in Excel, ensuring your spreadsheets are as informative and professional as possible.
Can I move multiple charts at once?

+
While Excel doesn’t provide a built-in feature to move multiple charts simultaneously, you can duplicate this action by copying each chart individually to the new sheet.
Will the chart update automatically after moving?

+
Yes, as long as your chart is linked to a data range or table, it will update automatically as the source data changes.
What if my chart link breaks when moving?

+
Check the data source in the Chart Tools > Design tab. If the data range has changed, update it to reflect the original source.


