5 Simple Steps to Create Excel Charts Easily

Creating charts in Excel is a fundamental skill for anyone who deals with data analysis, whether it's for business, research, or personal projects. Excel offers a plethora of chart types and customization options, making it an excellent tool for visually representing data. In this article, we'll walk through five simple steps to create and customize charts in Microsoft Excel, making data visualization both effective and user-friendly.
Step 1: Selecting Your Data

Before you can start making a chart, you need to have your data ready. Here’s how to prepare it:
- Ensure data is organized: Arrange your data in columns or rows. Each column or row should represent a different variable or category.
- Include labels: The first row or column often includes labels for your series or categories.
- Check for consistency: Make sure your data is free from errors or gaps, as these can skew your charts.
Step 2: Choosing the Right Chart Type

Excel provides various chart types tailored to different data sets and purposes:
| Chart Type | Use Case |
|---|---|
| Column Chart | Comparing values across categories. |
| Line Chart | Displaying trends over time. |
| Pie Chart | Showing proportions within a whole. |
| Bar Chart | Similar to column charts but with horizontal bars. |
| Scatter Plot | Analyzing relationships between variables. |
| Area Chart | Displaying trends with the area below the line filled. |

To choose the right chart:
- Consider the nature of your data and what you want to illustrate.
- Use Excel’s ‘Recommended Charts’ feature, which suggests chart types based on your selection.
💡 Note: The choice of chart type can significantly impact how easily your audience interprets the data.
Step 3: Inserting the Chart

Once you’ve selected your data:
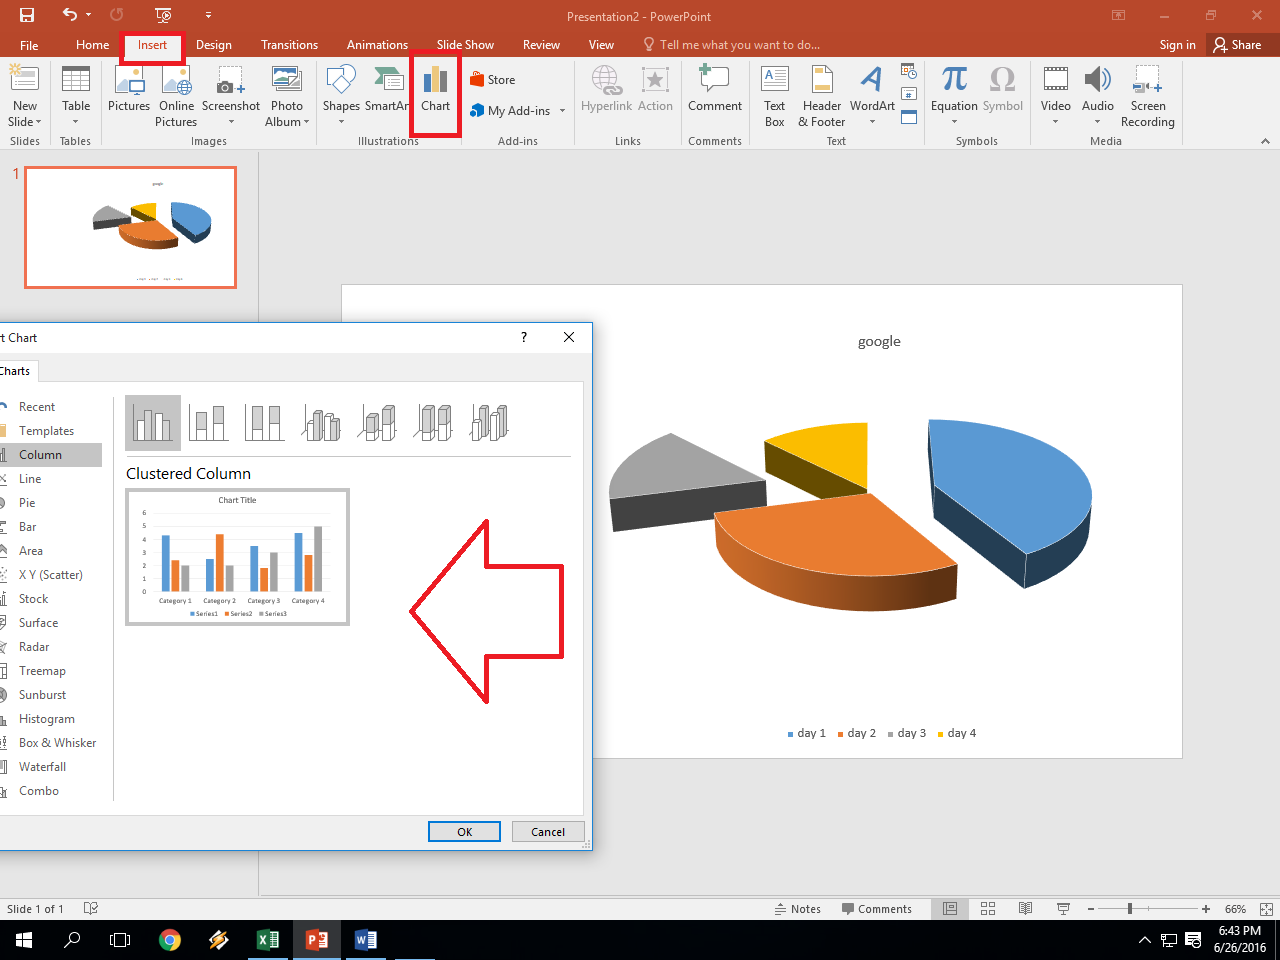
- Go to the Insert tab on Excel’s ribbon.
- Click on the Chart icon to open the chart menu.
- Choose your preferred chart type, and Excel will automatically insert a chart into your worksheet.
- If necessary, you can click on the chart to open the Chart Tools tab for further customization.
Step 4: Customizing Your Chart

Customization is key to making your charts informative and visually appealing:
- Title and Labels: Add a chart title that describes what the chart shows, and ensure axis labels are clear.
- Legend: Position the legend for easy reading; you can also edit the names or exclude unwanted series.
- Colors: Use colors to differentiate data series or categories effectively.
- Data Labels: Adding these can provide more precise information directly on the chart.
- Axes: Adjust the scale, add gridlines, or format the number display for better readability.
- Styles: Excel offers various chart styles for quick formatting.
👨💻 Note: Customizing your chart is where you can really highlight what's important and make your data story compelling.
Step 5: Saving and Sharing Your Chart

Once you’ve perfected your chart:
- Save: Ensure your Excel file is saved with your chart included.
- Copy Chart: You can copy the chart for use in documents or presentations by right-clicking and selecting Copy.
- Share: Excel allows you to share the entire workbook or specific charts through cloud services or by exporting to other formats like PDF or image files.
Following these steps, you'll find that creating charts in Excel is not only easy but also a powerful way to communicate your data insights. Whether you're tracking sales, analyzing scientific data, or simply organizing your personal finances, Excel's charting capabilities can help you present your findings in a way that is both professional and accessible.
What is the difference between a line chart and an area chart?

+
A line chart shows data points connected with lines, highlighting trends over time. An area chart does the same but fills the area below the line, providing a visual representation of volume or cumulative effect.
How do I change the data range of an existing chart?

+
To modify the data range in an existing chart, select the chart, go to the Chart Tools > Design tab, click on ‘Select Data’, and adjust the range in the ‘Select Data Source’ dialogue.
Can I create a chart from multiple sheets?

+
Yes, you can. Use the ‘Select Data Source’ dialog to add ranges from different sheets or consolidate data into one summary sheet before creating the chart.


