Excel Chart Magic: Create Charts Easily from Spreadsheets

Mastering Excel Charts: A Step-by-Step Guide to Data Visualization

Excel, Microsoft's powerful spreadsheet tool, has been the go-to software for countless individuals and businesses looking to organize, analyze, and present data. One of its most appreciated features is its ability to create charts, which turns rows of numbers into visual representations that are much easier to interpret. This article will walk you through the process of creating charts in Excel, offering tips to customize your charts for maximum impact, and exploring advanced chart options for those looking to elevate their data visualization skills.
Getting Started with Excel Charts

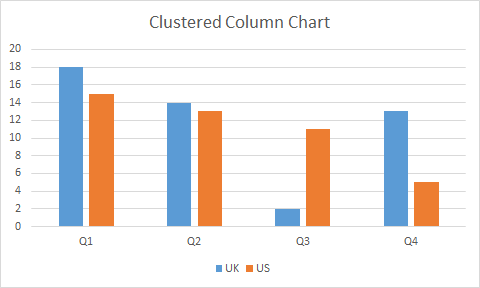
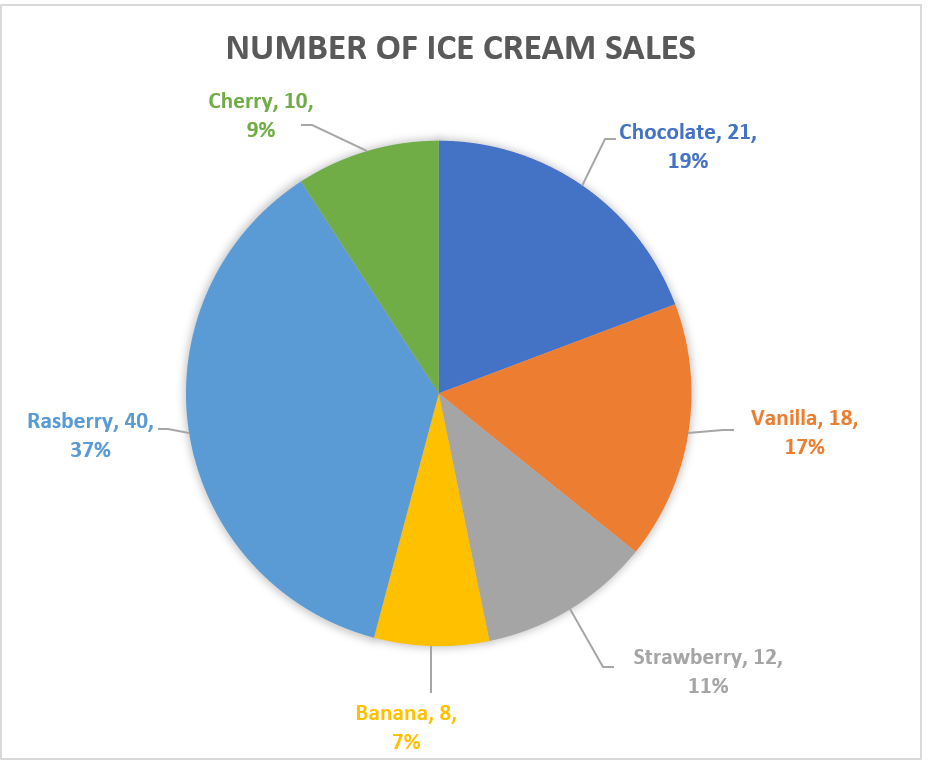
Excel provides a variety of chart types to choose from, including line graphs, bar charts, pie charts, scatter plots, and many more. Here's how you can start:
- Select Your Data: Click and drag your cursor to select the data you want to include in your chart.
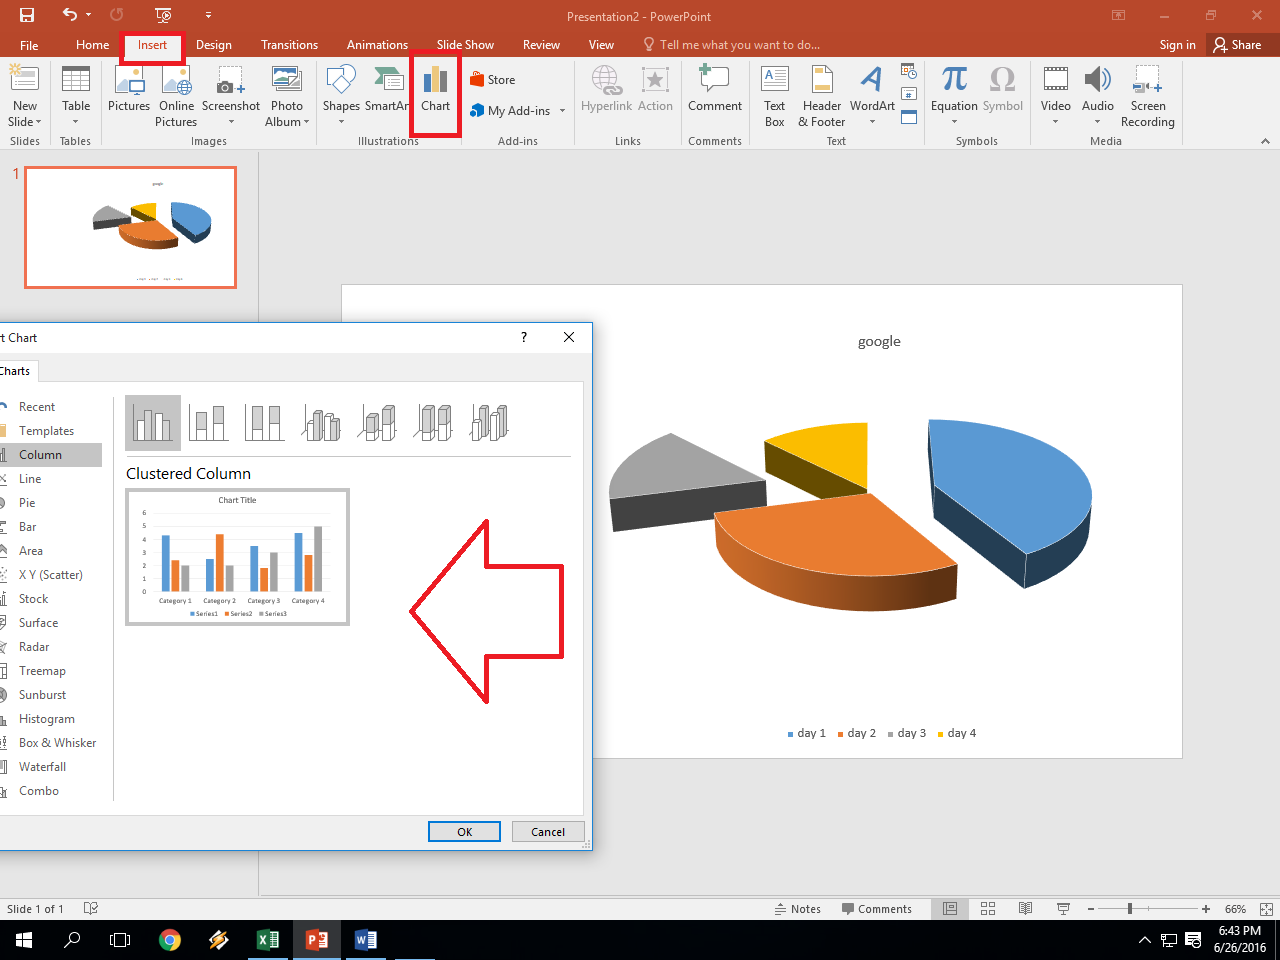
- Insert Chart: Go to the 'Insert' tab, and in the 'Charts' group, click on the type of chart you want to create. A preview will appear, allowing you to choose the best one.
- Choose Chart Type: Select from various chart types like column, bar, line, pie, area, etc., depending on your data's nature and the story you wish to tell.
💡 Note: When selecting data for your chart, ensure your dataset is free from unnecessary columns or rows that might clutter the visual.
Customizing Your Chart

Once your chart is created, customization is key to making it not only informative but also engaging:
Chart Elements

- Title: Add or edit the chart title to clearly indicate what the chart represents.
- Axes: Modify axis titles, labels, and scales. For charts with two axes, ensure both are labeled.
- Legend: Include a legend to denote what each color or symbol means on your chart.
- Data Labels: Add data labels to show specific values directly on the chart for quick reading.
Style and Layout

You can also adjust the chart's overall style:
- Chart Style: Select from predefined styles or manually change colors, fonts, and other style elements.
- Layout: Experiment with different layouts for your chart elements to improve readability.
| Option | Description |
|---|---|
| Change Chart Type | Switch between chart types or combine charts (e.g., bar and line on the same chart). |
| Select Data | Re-select or adjust the data source if changes are needed. |
| Format | Change fill, borders, and effects for individual chart elements. |

🌟 Note: To align your chart with your brand or presentation theme, consider customizing colors and fonts to match.
Advanced Charting Techniques

For those looking to delve deeper, Excel offers several advanced charting options:
Secondary Axes

- Use secondary axes to plot different data sets with different scales on the same chart.
Combination Charts

- Create combination charts where one series is plotted as columns and another as lines to compare different types of data.
Data Analysis Tools

- Use features like Trendlines, Moving Averages, or Error Bars to enhance the analytical aspect of your charts.
📊 Note: Advanced charting can significantly improve the depth of your data analysis but requires a good understanding of your data and the story you want to tell.
Ensuring Accessibility

Charts should be accessible to everyone, including those with visual impairments:
- Use of Color: Choose color schemes that are colorblind friendly.
- Alternative Text: Add descriptive alternative text for charts to help screen readers describe them to users with visual impairments.
- High Contrast: Ensure there is enough contrast between chart elements and the background.
Creating charts in Excel is not just about displaying data; it's about storytelling with numbers. By following these steps and tips, you can craft charts that are not only visually appealing but also rich in insights. Remember, the goal is to make your data accessible, understandable, and compelling to your audience.
What are the most common chart types used in Excel?

+
The most common chart types include Column, Bar, Line, Pie, Scatter, and Area charts. Each serves different purposes based on the type of data you’re visualizing.
How can I make my charts accessible?

+
Ensure your charts use contrasting colors, include alternative text for screen readers, and use patterns or textures in addition to colors for different data series.
Can I create dynamic charts in Excel that update with new data?

+
Yes, by using Tables or Named Ranges, charts can update automatically when new data is added or existing data changes.
What is the best way to choose the right chart for my data?

+
Consider what you want to show: Use bar charts for comparisons, line charts for trends over time, pie charts for parts of a whole, and scatter plots for relationships between variables.


