Create a Simple Balance Sheet in Excel 2013 Quickly

Creating a balance sheet is fundamental in understanding the financial health of a business or personal finances. It allows you to quickly grasp what you own (assets) versus what you owe (liabilities), thereby giving you a snapshot of your net worth. Excel 2013, with its robust functionalities, provides a simple yet powerful platform to create this crucial financial statement. Here's how you can set up your balance sheet in a quick and efficient manner:
Starting with Excel

Begin by opening Microsoft Excel 2013. Here are the steps to follow:
- Open Excel. If you don’t have a pre-made template, choose ‘Blank workbook’.
- Save your workbook with a descriptive name like ‘Balance Sheet MMYY’. This helps in version control.
Layout of Your Balance Sheet

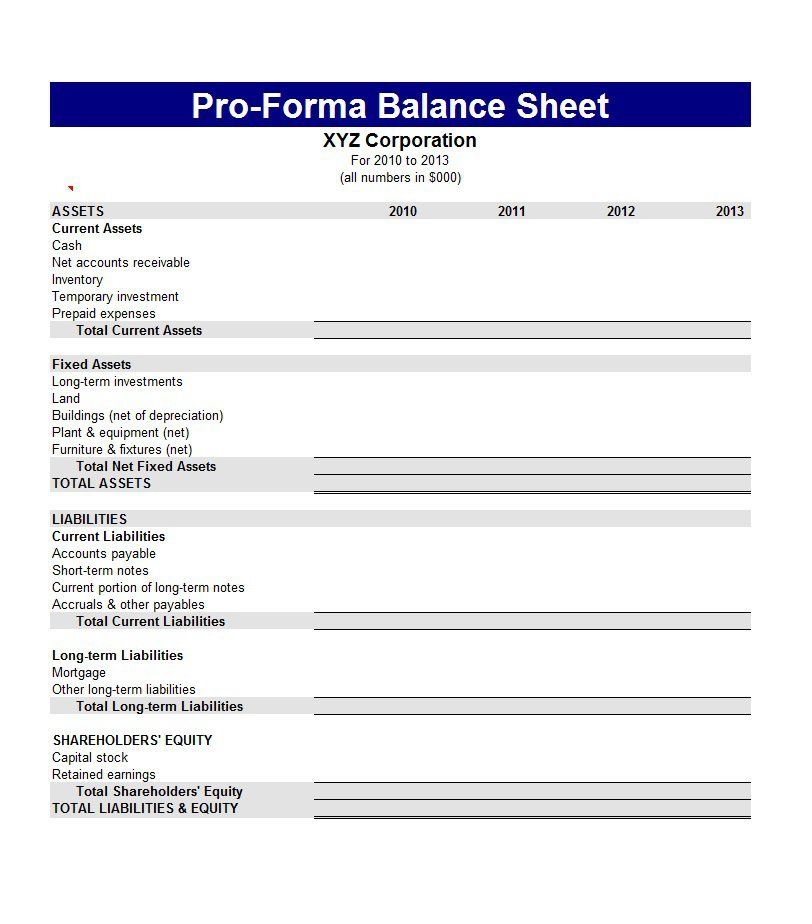
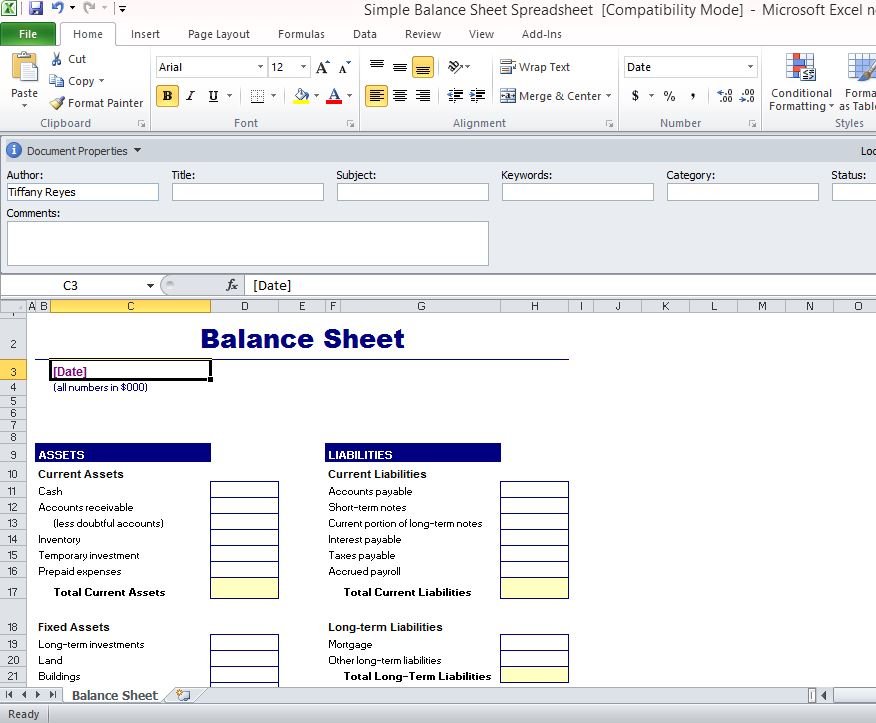
The basic layout of a balance sheet includes:
- Header: Date, Company/Personal Name, and Title ‘Balance Sheet’.
- Assets: Listed on the left or top, grouped by liquidity.
- Liabilities: On the right or below assets, sorted by due date.
- Equity: The difference between assets and liabilities, typically at the bottom or right.
Here is how you can structure it:
| Assets | Liabilities |
|---|---|
| Cash & Bank Accounts | Accounts Payable |
| Investments | Credit Card Debt |
| Property & Equipment | Loans |
| Other Assets | Other Liabilities |

Entering Your Data

To enter your financial data:
- Assets:
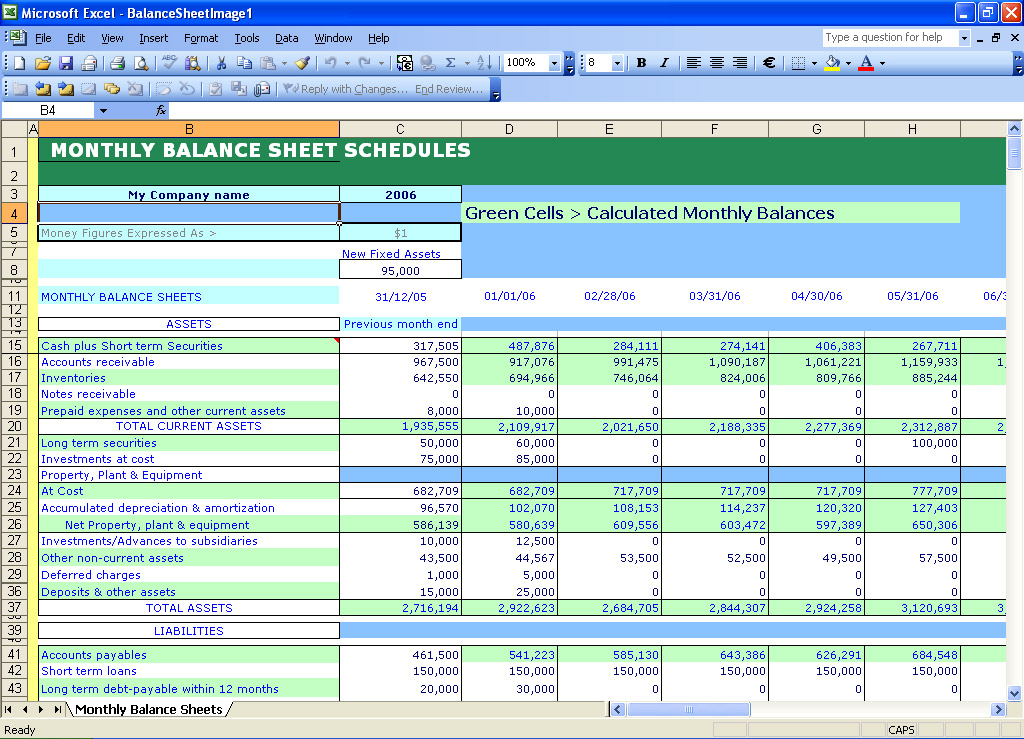
- Input cash, accounts receivable, inventory, property, investments, and other relevant assets. Remember to include current and fixed assets.
- Sum up your assets using the SUM function. You can do this with:
=SUM(B2:B6)where B2 to B6 are your asset values.
- Liabilities:
- Enter accounts payable, loans, credit card debts, and other liabilities. Include both current and long-term liabilities.
- Total your liabilities similarly using the SUM function:
=SUM(D2:D6).
- Equity:
- Calculate equity as the difference between total assets and total liabilities using
=B7-D7.
- Calculate equity as the difference between total assets and total liabilities using
💡 Note: Ensure that your data is entered accurately to avoid discrepancies in your balance sheet.
Formatting Tips

For better readability:
- Use different fonts, sizes, or colors for headings and sub-headings.
- Format the totals and the equity line in bold or italic.
- Apply cell borders and shading to distinguish between asset and liability sections.
🔍 Note: Proper formatting not only enhances the look but also helps in quickly understanding the balance sheet’s structure.
Updating and Sharing Your Balance Sheet

To ensure your balance sheet remains up-to-date:
- Regularly update the figures in your Excel file.
- Consider automating some entries with Excel formulas to reduce manual input.
- Save a version-controlled copy of your balance sheet after each update.
- For sharing:
- You can protect your sheet by setting a password (Review > Protect Sheet).
- Use Excel’s commenting feature to explain unusual entries or provide additional context.
- Email or share through cloud services like OneDrive, ensuring recipients have the necessary permissions to view or edit.
Insights from Your Balance Sheet

Once your balance sheet is set up, here are some insights you can draw:
- Liquidity: Check your current ratio (current assets divided by current liabilities). A ratio over 1 suggests good liquidity.
- Leverage: The debt-to-equity ratio provides insight into financial risk. A high ratio might indicate reliance on debt, while a low ratio could suggest a stronger equity position.
- Net Worth: Your equity line shows your net worth, highlighting whether you’re growing or shrinking financially.
🔎 Note: Remember, your balance sheet gives you a moment in time snapshot. Regular updates and analyses will provide more comprehensive insights.
In conclusion, crafting a simple balance sheet in Excel 2013 is not only an exercise in financial management but also a powerful tool for decision making. By organizing your financial data in this structured manner, you gain insights into your liquidity, leverage, and overall financial health. Keep this document updated to track your financial progress over time, and use the insights to make informed decisions on investments, cost management, and future financial planning.
What should I include in the ‘Other Assets’ category?

+
The ‘Other Assets’ category can include anything not covered by the main categories like cash, investments, or property. This might include prepaid expenses, intangible assets like patents, or even deferred tax assets.
Can I use Excel for personal finances?

+
Yes, Excel is an excellent tool for personal finance management. You can track your income, expenses, savings, investments, and debts in a similar format to a business balance sheet, giving you a clear picture of your financial position.
How do I ensure my balance sheet is accurate?

+
Regular reconciliation with bank statements and financial documents, cross-checking your figures with source documents, and reviewing for any discrepancies or double-counting will ensure your balance sheet’s accuracy.
How often should I update my balance sheet?

+
For businesses, it’s typically updated monthly or quarterly. For personal finance, consider updating it at least annually, or more frequently if you’re managing investments or undergoing significant financial changes.
What does a positive equity on my balance sheet mean?

+
A positive equity indicates that your assets exceed your liabilities, which means you have a net worth. This is a sign of financial health, showing you have more resources than obligations.


