Graph Data Across Sheets in Excel Easily

Managing and visualizing data across multiple sheets in Excel can be a daunting task, especially when dealing with large datasets or complex projects. However, with the right techniques, you can streamline this process and make your data management more efficient. This comprehensive guide will walk you through various methods to graph data across sheets in Excel, ensuring your data visualization is not only effective but also visually appealing.
Understanding Excel Sheets and Data Management

Before diving into the graphing process, it’s crucial to understand how Excel handles data across multiple sheets:
- Named Ranges: Define specific cells or ranges with a name for easier reference.
- External Links: Formulas or functions that refer to data in another workbook or sheet.
- Data Consolidation: Summarize and analyze data from multiple sheets into one place.
Preparing Your Data

Start by organizing your data in a structured manner. Here are some steps:
- Ensure data consistency across sheets.
- Name your sheets descriptively to aid in data navigation.
- Use named ranges for key data segments.
Consolidation for Graphing

To graph data from multiple sheets, we often need to consolidate this information:
| Consolidation Method | Description |
|---|---|
| Link Cells | Manually link cells from different sheets into one sheet using formulas like =‘SheetName’!A1. |
| Consolidate Tool | Use Excel’s built-in Consolidate feature to summarize data from multiple sheets or ranges. |
| Advanced Filters | Extract and consolidate data based on specified criteria across multiple sheets. |

💡 Note: When using consolidation methods, ensure that your source data is formatted similarly across all sheets to prevent errors.
Creating Graphs Across Sheets

Once your data is prepared, here’s how to create charts that pull information from multiple sheets:
Linking Data from Multiple Sheets

To create a graph, you’ll first need to link data across sheets:
- Select a cell where you want to display the consolidated data.
- Enter a formula that references the data in another sheet, for example:
=‘Sheet2’!A1. - Drag the fill handle to copy this formula for all relevant cells.
Using Named Ranges for Dynamic Graphing

Named ranges make it easier to update graphs dynamically:
- Define your data range on each sheet with names like ‘SalesData_Sheet1’.
- Create a summary sheet where you reference these named ranges.
- Construct your graph using the summary sheet, and the graph will update as data changes on other sheets.
3D References for Summarizing Data

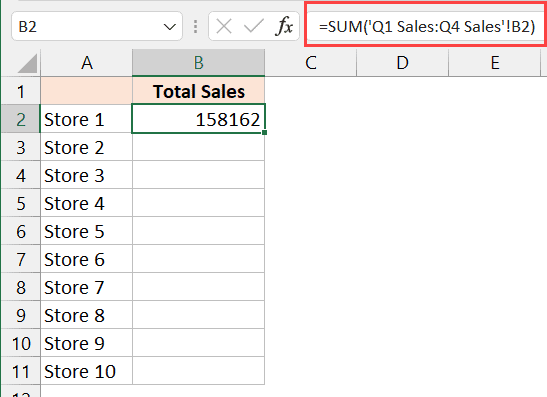
Excel’s 3D formula can reference entire ranges across multiple sheets:
=SUM(Sheet1:Sheet3!A1)
This function adds the value in cell A1 from Sheet1, Sheet2, and Sheet3, allowing you to quickly summarize data for graphing.
Graphing Techniques

- Standard Charts: Use Excel’s charting tool to plot the consolidated data from your summary sheet.
- Pivot Charts: Leverage PivotTables to dynamically filter, sort, and summarize data across sheets, then create a chart from this.
- Dashboards: Create a dashboard by combining multiple charts on one sheet to visualize data from various sources.
Advanced Graphing Options

For more complex scenarios:
- Power Query: Use to merge data from multiple sheets or even workbooks, preparing it for graphing.
- Power BI: Connect Excel to Power BI for advanced data visualization capabilities.
🔗 Note: Power Query and Power BI can be quite powerful but might require learning new tools. Start with standard Excel functions if you're new to data analysis.
After following these steps, you'll have a series of graphs and charts that seamlessly integrate data from across different sheets. This approach not only saves time but also reduces the risk of errors, as data references are automated. Remember, the key to successful graphing across sheets is in the preparation and structuring of your data. Excel provides robust tools to help you organize, consolidate, and visualize your data, making complex analysis accessible.
By implementing these techniques, you'll be able to analyze trends, highlight key data points, and make informed decisions based on comprehensive visualizations of your multi-sheet data. Excel's ability to handle data across sheets, combined with its graphing capabilities, makes it an indispensable tool for anyone looking to analyze and present complex datasets effectively.
How do I ensure consistency across multiple sheets?

+
To ensure consistency, use uniform formatting for headers and data types. Regularly update and check each sheet for any discrepancies or changes in data structure.
Can I dynamically update graphs when new data is added?

+
Yes, by using named ranges or 3D references, your graphs can update automatically as you add data to the source sheets.
What if my data is in different formats across sheets?

+
Use Excel’s Power Query or pivot tables to transform and standardize data from multiple sheets before graphing. This can help in aligning different data formats.
Can I share these multi-sheet graphs?
+Yes, you can share the Excel file with others, and the graphs will remain dynamic if the data source files are linked or shared together.


