Extract Balance Sheet Easily in Excel: A Step-by-Step Guide

In the world of finance, Excel remains an indispensable tool for accountants, analysts, and business owners alike. Whether you're managing personal finances or performing complex financial analysis for a corporation, knowing how to effectively use Excel can streamline your work, especially when dealing with tasks like extracting and analyzing a balance sheet. This guide provides a comprehensive walkthrough on how to extract and manipulate a balance sheet in Microsoft Excel, ensuring that both financial novices and seasoned professionals can benefit from this essential skill.
Understanding the Balance Sheet

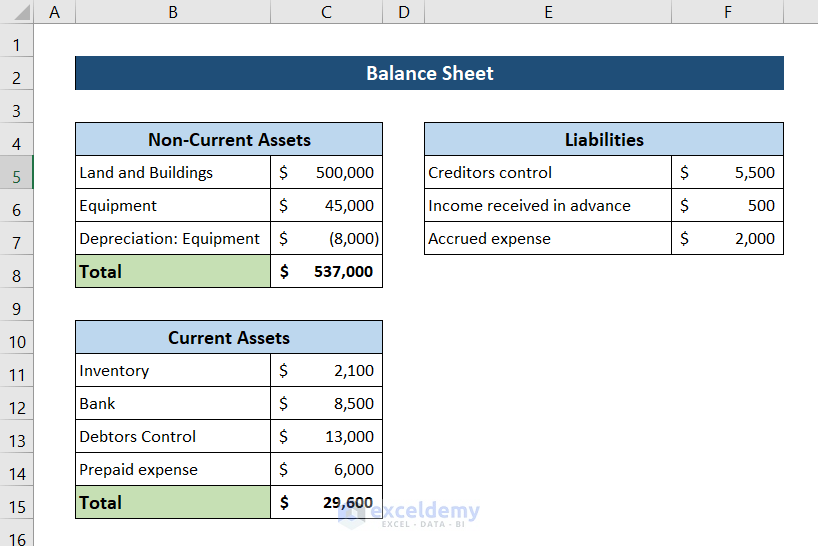
Before diving into Excel’s functionalities, it’s crucial to understand what a balance sheet is. A balance sheet presents a company’s financial position at a specific point in time by listing its assets, liabilities, and shareholders’ equity. Here’s a quick overview:
- Assets: Resources owned by the company that have future economic value.
- Liabilities: Financial obligations or debts owed by the company.
- Equity: Ownership interest or the residual interest in the assets after deducting liabilities.
The fundamental equation of a balance sheet is:
Assets = Liabilities + Equity

Extracting Data into Excel

Now, let’s dive into the practical steps to extract and work with balance sheet data in Excel:
1. Set Up Your Data Source

If you have an existing financial report or a PDF version of a balance sheet, you can use tools like Adobe Acrobat or online OCR services to convert the text into an editable format. Here’s how:
- Open the PDF with a compatible reader like Adobe Acrobat.
- Use the export or convert feature to convert the PDF into a Word or Excel file.
- Alternatively, use online OCR (Optical Character Recognition) tools to extract text from the PDF.
2. Importing the Data into Excel

Once your data is in an editable format:
- Open Excel.
- Go to File > Open if your file is already in Excel format.
- For data from other formats like Word:
- Use Data > From Text to import TXT files.
- Use Get Data > From File > From Text/CSV for CSV files.
- If your data source is an online document, you might need to copy and paste it into Excel manually or through Excel’s web queries feature.
3. Organizing Your Balance Sheet Data

Organize the data in a structured manner:
- Label columns appropriately with headers like “Accounts,” “Value,” “Type” (Assets, Liabilities, Equity).
- Use Excel formulas to calculate totals:
- =SUM(A1:A10) for summing values.
- =VLOOKUP() to find corresponding accounts if needed.
| Account | Value | Type |
|---|---|---|
| Cash | 5000 | Assets |
| Accounts Receivable | 7500 | Assets |
| Total Assets | =SUM(B2:B3) | Assets |
| Accounts Payable | 4000 | Liabilities |
| Long-term Debt | 10000 | Liabilities |
| Total Liabilities | =SUM(B5:B6) | Liabilities |
| Shareholders' Equity | =B4-B7 | Equity |

4. Analyzing the Balance Sheet

With your data in Excel, you can now perform various analyses:
- Ratio Analysis: Use formulas to calculate financial ratios like the current ratio (=B4/B7), quick ratio, etc.
- Common Size Analysis: Convert each account into a percentage of total assets or liabilities.
- Trend Analysis: If you have multiple periods of data, create line charts to see trends over time.
📚 Note: Always ensure your data is clean, consistent, and correctly formatted to avoid errors in calculations and analysis.
5. Creating Visuals

Visual representation helps in understanding the data better:
- Create pie charts to show the composition of assets or liabilities.
- Use bar charts for comparing different periods.
- Line graphs are excellent for trend analysis.

📝 Note: When creating visuals, choose chart types that best represent the data you're analyzing. Pie charts are great for showing proportions, while bar and line graphs work well for comparisons and trends.
6. Printing and Sharing

When ready to share or present your analysis:
- Format your spreadsheet for readability, adjusting font sizes, styles, and colors.
- Use Excel’s Page Layout options to prepare for printing or PDF export.
- Set print area to include only relevant data.
- Adjust margins, headers, and footers for a professional look.
- Save or export your document for sharing. Use File > Save As or Export options.
In wrapping up, the process of extracting and analyzing a balance sheet in Excel is not just about number crunching; it’s about transforming raw financial data into actionable insights. By following the steps outlined in this guide, you’ve learned how to:
- Import and organize balance sheet data efficiently.
- Utilize Excel’s functionalities to perform detailed financial analysis.
- Create compelling visuals to support your analysis.
- Prepare your work for presentation or further discussions.
This knowledge empowers you to gain deeper insights into the financial health of a business, make informed decisions, and communicate financial information clearly and effectively.
What if my balance sheet data is in a format not supported by Excel?

+
If your balance sheet data is in an incompatible format, you can convert the file to a text file or use an OCR tool to extract the data into a readable format. Tools like Adobe Acrobat or free online OCR services can help with this conversion.
How can I ensure the accuracy of my data when importing into Excel?

+
Double-check your data sources for consistency. Use Excel’s data validation tools to set rules for data entry, and compare totals from different sections to ensure they balance out according to the balance sheet equation.
Can I automate the extraction of balance sheet data?

+
Yes, with the use of Excel macros (VBA) or specialized financial software, you can automate data extraction. This reduces manual errors and speeds up the process, especially if you’re dealing with repetitive tasks or need real-time data updates.


