Create an Effective Excel Tracking Sheet Easily

Microsoft Excel offers powerful tools for organizing and analyzing data, but one of the simplest yet most powerful uses is creating tracking sheets. Whether it's for managing a personal budget, tracking project progress, or monitoring daily tasks, an Excel tracking sheet can simplify your life by providing a clear, organized, and customizable solution.
What is an Excel Tracking Sheet?
An Excel tracking sheet, or Excel tracker, is essentially a spreadsheet designed to record, monitor, and manage different types of data. From simple lists to complex data sets, a tracking sheet in Excel allows you to:
- Input and organize data in rows and columns.
- Use formulas to automate calculations.
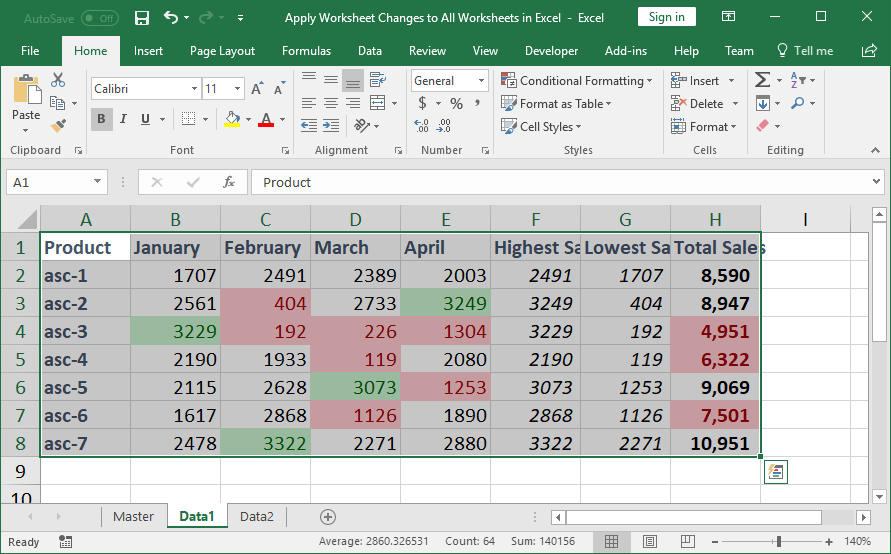
- Apply conditional formatting to highlight important information.
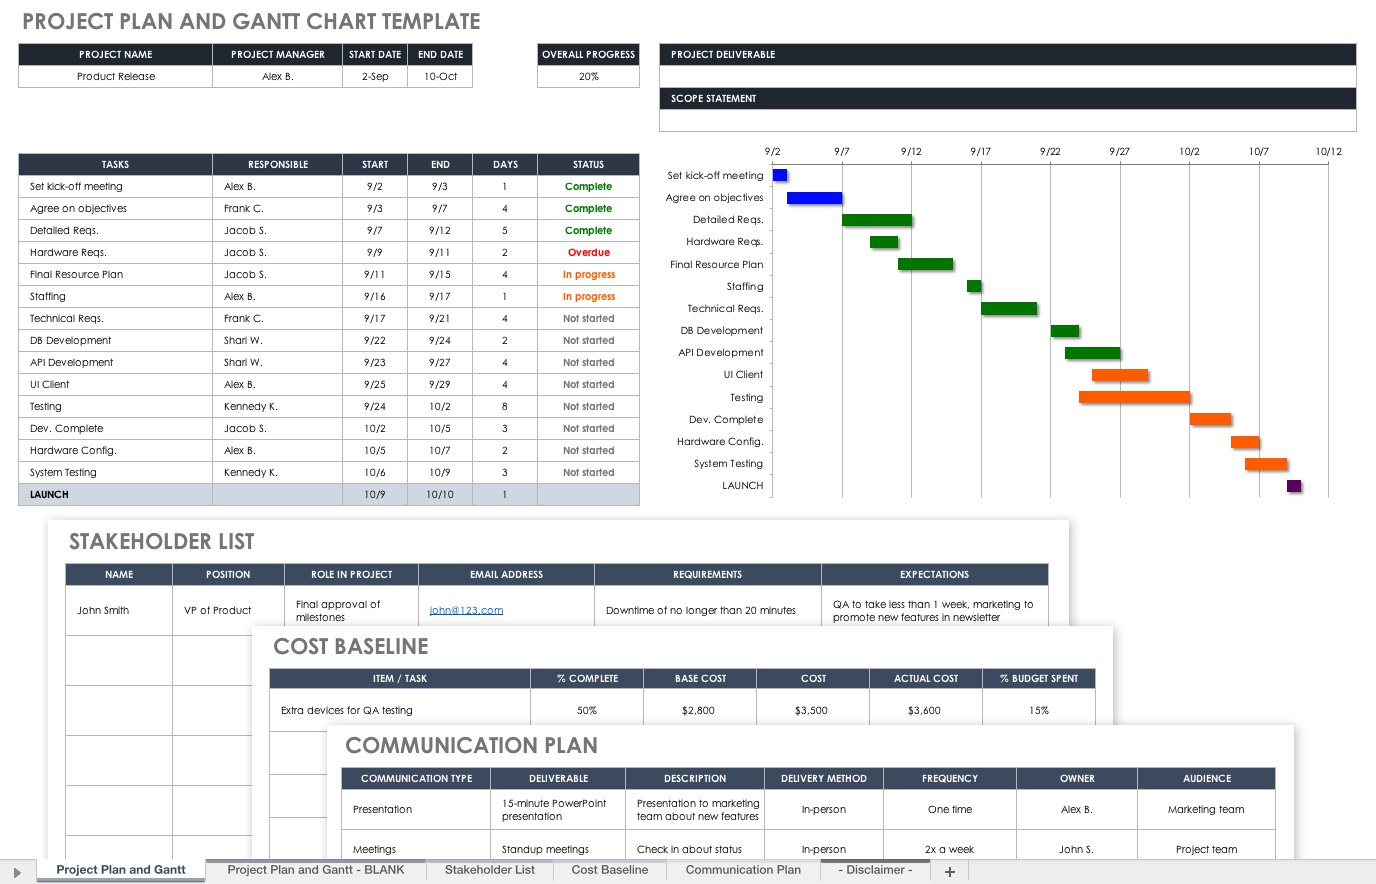
- Generate charts or graphs for visual representation of data trends.
Steps to Create a Simple Excel Tracking Sheet
Step 1: Define the Purpose
Before diving into Excel, clearly define what you need to track. This could be:
- Personal finances (expenses, income, savings).
- Project tasks with deadlines and progress updates.
- Inventory levels for business purposes.
- Health metrics like diet, exercise, or sleep patterns.
Step 2: Structure Your Sheet
Open a new Excel workbook and decide on the structure:
- Column Headers: What type of information will you track? Common headers might include Date, Description, Category, Amount, etc.
- Rows: Each row can represent a single entry or event.
💡 Note: Keep your column headers descriptive but concise for better readability.
Step 3: Input Data
Start filling in your data:
- Input each record or data point in its respective row.
- Use the headers to guide your entries.
- Keep consistency in your data input format to ensure formulas and sorting work smoothly.
Here's a simple structure for a personal budget tracker:
| Date | Description | Category | Income | Expense | Balance |
|---|---|---|---|---|---|
| 01 Jan 2023 | Salary | Income | $5000 | $5000 | |
| 02 Jan 2023 | Groceries | Expense | $100 | $4900 | |
| 03 Jan 2023 | Dining Out | Expense | $50 | $4850 |
Step 4: Use Formulas for Calculations
Excel's real power shines through its formulas. Here are some useful ones for tracking sheets:
- Sum: =SUM(range) for adding values.
- Average: =AVERAGE(range) to get the mean.
- If Statements: =IF(logical_test, value_if_true, value_if_false) to categorize data.
- Date Functions: =TODAY(), =DATE() to manage dates easily.
Step 5: Apply Formatting
To enhance readability and functionality:
- Highlight critical data with conditional formatting.
- Freeze panes to keep headers in view when scrolling.
- Use different colors or font styles to differentiate between data categories.
Creating a visually appealing tracking sheet can improve data interpretation:
👀 Note: Use conditional formatting to instantly see which expenses are high or when projects are overdue by setting color scales or icon sets.
Step 6: Data Validation and Protection
Ensure data consistency and accuracy:
- Use Data Validation to limit what can be entered into cells.
- Protect the workbook or specific sheets to prevent accidental changes.
Step 7: Analyze and Visualize Data
To make sense of your data:
- Create pivot tables for complex data analysis.
- Insert charts (e.g., pie, bar, line) to visualize trends or patterns.
- Use filters to sort through or view specific subsets of data.
Over time, as you add more data, you'll find these tools invaluable for spotting trends, making decisions, or just keeping everything organized.
📈 Note: Charts can make data trends easily digestible at a glance, enhancing communication in reports or presentations.
Summing up, creating an effective Excel tracking sheet involves planning, inputting and organizing data, using formulas for automation, applying visual enhancements, and securing your data. Whether for personal, professional, or business use, Excel’s versatility makes it an invaluable tool for tracking and managing a wide range of information. By leveraging these steps, you can maintain a dynamic, informative, and user-friendly tracking sheet tailored to your needs.
What makes Excel a good choice for tracking data?
+
Excel’s versatility comes from its ability to handle large datasets, automate calculations, and visualize data with charts. It’s user-friendly for basic tracking tasks while offering advanced features for in-depth analysis.
Can I share my tracking sheet with others?
+
Yes, Excel allows sharing through cloud storage like OneDrive, where multiple users can edit simultaneously or access a read-only version. You can also export sheets as PDFs or use Excel’s built-in collaboration features.
How often should I update my tracking sheet?

+
The frequency depends on your tracking goals. For daily expenses or tasks, daily updates are ideal. For project management or inventory, weekly or monthly updates might be sufficient.
Is it possible to automate Excel tracking sheets?
+Yes, with macros (VBA), functions, and formulas, you can automate many tasks. For instance, setting up data entry forms or automatically calculating totals and trends.
How do I ensure data integrity in my tracking sheet?
+Use data validation to restrict inputs, protect cells or sheets from editing, and maintain regular backups to ensure data integrity. Also, regular checks for formula accuracy help maintain data consistency.


