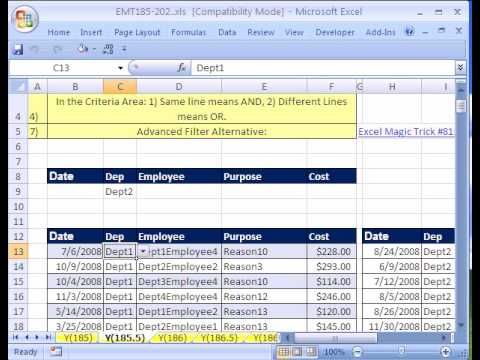
Excel Sheet Magic: Quick Guide to Creating Your Own

Learning how to manage, analyze, and visualize data can seem daunting, but Microsoft Excel offers a plethora of tools that simplify this process. Whether you're a student, a professional, or a hobbyist, understanding the basics of Excel sheet creation can significantly boost your productivity and data analysis capabilities.
Understanding Excel Basics

Before diving into the creation of your Excel sheets, it’s crucial to familiarize yourself with some fundamental Excel features:
- Workbooks and Worksheets: A workbook is an Excel file that contains one or more sheets called worksheets. Each worksheet is like a blank canvas where you can input and manipulate data.
- Cells: The intersection of rows and columns forms cells, where you enter data. Each cell can hold numbers, text, formulas, or functions.
- Formulas and Functions: Excel uses formulas to perform calculations. Functions are predefined formulas that make complex operations straightforward.
Creating Your First Excel Sheet

Opening a New Workbook

To start your Excel journey, follow these steps:
- Open Microsoft Excel from your desktop or start menu.
- Select ‘New Blank Workbook’ to create a new file or choose a template if applicable.
- Excel will open with a blank worksheet named “Sheet1” by default.
Inputting Data

Now that you have a new worksheet, let’s fill it with some data:
- Click on a cell to select it. Type your data into the cell and press Enter or Tab to move to the next cell.
- For large datasets, consider using the Data Import feature where you can import data from various sources like CSV files, databases, or other Excel files.
💡 Note: Ensure your data entries are consistent. For instance, if you’re inputting dates, keep a uniform format throughout your sheet.
Formatting Your Data

Basic Formatting

Once your data is in place, formatting can help you present it more effectively:
- Highlight cells and use options like Bold, Italic, Underline, and Change Font Size to distinguish headings.
- Use ‘Format Cells’ to change number formats, alignment, borders, and more. You can access it by right-clicking a cell and selecting ‘Format Cells’.
Conditional Formatting

Conditional Formatting allows you to visually highlight cells that meet certain criteria:
- Select the cells you want to format.
- Navigate to ‘Home’ > ‘Conditional Formatting’.
- Choose a rule (e.g., ‘Greater Than’, ‘Less Than’, ‘Equal To’) and set your criteria.
- Select a format to apply when the condition is met (like font color, fill color, etc.).
| Condition | Description | Example Format |
|---|---|---|
| Cell Value > 50 | Cells with a value greater than 50 | Light Red Fill with Dark Red Text |
| Text contains “Apple” | Any cell containing the text “Apple” | Green Fill |

Data Analysis Tools

Formulas and Functions

Excel’s strength lies in its ability to perform complex calculations with simple formulas:
- SUM: Adds up numbers in a range. Example:
=SUM(A1:A5) - AVERAGE: Calculates the average of a range. Example:
=AVERAGE(B2:B7) - IF: Performs logical tests. Example:
=IF(C1>50, “Excellent”, “Normal”)
PivotTables

PivotTables are one of Excel’s most powerful features for data summarization:
- Select your data range.
- Go to ‘Insert’ > ‘PivotTable’.
- Choose where you want the PivotTable to be placed.
- Drag and drop fields into the PivotTable Fields pane to analyze data from different perspectives.
🔍 Note: PivotTables are dynamic. You can refresh them if your source data changes to reflect the new data.
Charting for Visual Insights

Charts help to present your data visually:
- Select the data range you wish to chart.
- Navigate to ‘Insert’ > ‘Chart’ and choose the type of chart that suits your data (e.g., Pie, Line, Column).
- Use the ‘Chart Tools’ that appear to customize your chart further with titles, labels, and colors.
Advanced Excel Tricks

Macros for Automation

For repetitive tasks, you can automate processes using VBA (Visual Basic for Applications):
- Go to ‘Developer’ tab (you might need to enable it from Excel Options).
- Click ‘Record Macro’, perform your actions, and stop recording.
- Run the macro when needed to replicate your steps automatically.
Data Validation

Data Validation ensures data integrity by restricting what users can enter into cells:
- Select cells for validation.
- Go to ‘Data’ > ‘Data Validation’.
- Set up criteria like list, date range, or custom formula for what the cells should accept.
As we've explored, Excel provides a vast array of tools and functionalities that can help you from basic data entry to sophisticated data analysis. Whether you're using it for personal finance tracking, project management, or as part of a complex data-driven environment, mastering Excel can truly unlock your data's potential. With the ability to format, analyze, chart, and automate processes, your journey into Excel sheet creation is an investment in your efficiency and analytical skills. Remember to continually experiment with Excel's features to discover new ways to make your data tell a story.
What are the benefits of using Excel for data analysis?

+
Excel offers simplicity for beginners, comprehensive calculation capabilities, and extensive data visualization options. It’s widely used, making it excellent for collaboration. Features like PivotTables, macros, and formulas allow for in-depth analysis without the need for specialized software.
Can I protect my data in Excel?

+
Yes, Excel provides various security options like password protection for workbooks and worksheets, restricting cell editing, and even hiding formulas to safeguard your data.
How can I improve the performance of my Excel workbook?
+To enhance performance, reduce the use of volatile functions, limit references to other workbooks, use tables for large datasets, and optimize macros and calculations settings.


