5 Ways to Revamp Your Excel Sheet Design

Microsoft Excel is more than just a tool for crunching numbers; it's a canvas where data meets design. For many professionals, the clarity and aesthetic appeal of an Excel sheet can significantly enhance the effectiveness of data presentation. Whether you're looking to impress in a business meeting, streamline your personal budget, or simply make your work life easier, revamping your Excel sheet design can make a substantial difference. Here, we will explore five innovative ways to transform your Excel spreadsheets from mundane to magnificent.
1. Master Color Coding

Color coding is a powerful tool in Excel for improving both the readability and visual appeal of your spreadsheets. However, it's not just about splashing colors randomly. Here's how to use color effectively:
- Functionality: Assign colors to different types of data or categories. For instance, use green for positive financial values, red for negatives, and blue for neutral or miscellaneous data.
- Consistency: Decide on a color palette early in your design process and stick to it. This ensures that users can quickly adapt to your system.
- Visibility: Ensure your colors are distinguishable, especially for those with color vision deficiencies. Tools like color blind friendly palettes can be found online.

💡 Note: Remember that overuse of color can distract rather than enhance. Keep it minimal yet impactful.
2. Embrace Conditional Formatting

Conditional formatting is a feature that allows you to format cells automatically based on the cell's value. Here are some ways to harness this feature:
- Data Bars: Provide a bar representation of values, making it easier to spot trends at a glance.
- Icon Sets: Use icons like arrows, flags, or symbols to indicate status or trend directions.
- Color Scales: Apply a gradient of color to cells, with colors changing as the data meets certain criteria, like heat maps.
- Highlighting Cells: Use color fills or font styles to highlight cells that meet specific conditions, e.g., values over a threshold.

3. Utilize Smart Layouts

An Excel sheet's layout can dramatically affect its usability. Consider these layout tips:
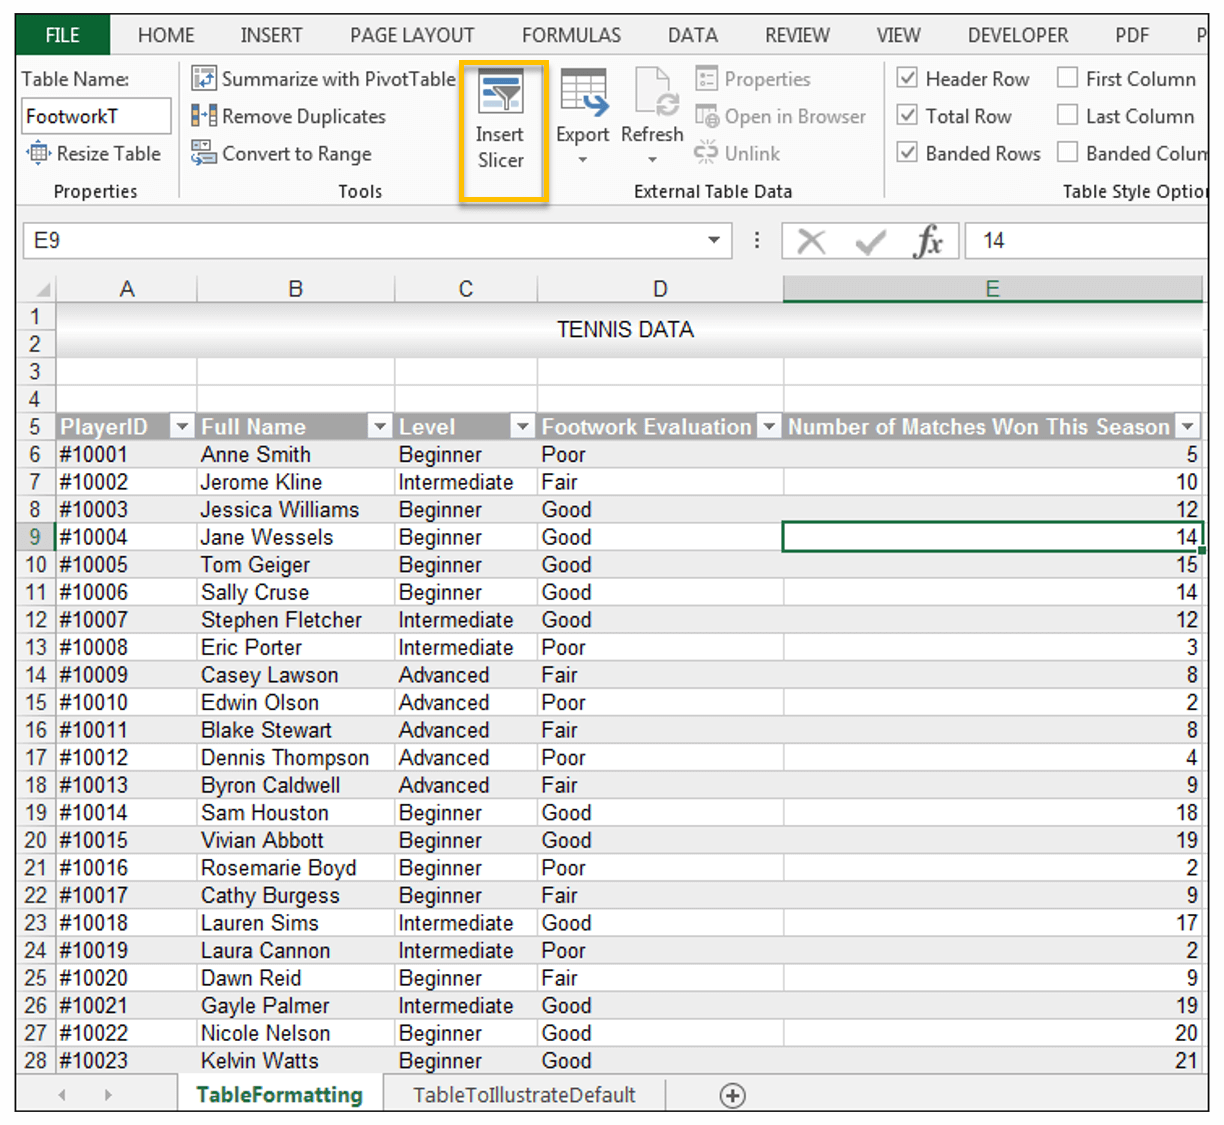
- Table Design: Convert your data into a table to take advantage of sorting, filtering, and auto-formatting features.
- Grouping: Use Group functionality to collapse or expand sections of your sheet for better organization.
- Freeze Panes: Keep headers or important rows/columns visible while scrolling through large datasets.
- Page Layout: Set up your sheet to print beautifully by adjusting margins, headers, footers, and page orientation.
| Layout Feature | Description | Benefit |
|---|---|---|
| Freeze Panes | Freezes specific rows or columns | Allows scrolling without losing header reference |
| Group & Outline | Organizes data into expandable sections | Helps in managing complex datasets |
| Table Design | Converts data range into a formal table | Enhances functionality and visual clarity |
| Page Layout | Adjusts print settings | Ensures professional-looking printed documents |

📌 Note: A well-organized layout reduces the time users spend searching for information, making your Excel sheet user-friendly.
4. Implement Dashboard Design

Dashboards in Excel provide an at-a-glance view of key metrics or KPIs. Here's how to design an effective dashboard:
- Data Visualization: Use charts, graphs, and pivot tables to summarize data. Choose visuals that best represent your data's story.
- Interactive Elements: Incorporate slicers, timeline filters, and interactive controls for dynamic data exploration.
- User Interface: Keep the dashboard clean, using a minimalistic design approach to avoid overwhelming the user.
- Dynamic Range: Utilize dynamic named ranges or tables so that your dashboard updates automatically as data changes.

5. Optimize for Mobile Use

As work becomes more mobile, your Excel sheets should be as well. Here are steps to ensure your spreadsheets are mobile-friendly:
- Simplify Design: Opt for a cleaner, less cluttered design to facilitate viewing on smaller screens.
- Mobile-Friendly Navigation: Use split-screen or tabbed interfaces to make navigation easier on mobile devices.
- Responsive Charts: Create charts that adapt to various screen sizes without losing legibility.
- Use Touch Controls: Consider adding touch-friendly buttons or forms for data input on mobile devices.
By integrating these design elements, your Excel sheets will not only be more functional but also a pleasure to work with. Remember, the aim is to make the data more accessible, understandable, and visually appealing without overwhelming the user. With thoughtful application of these methods, your spreadsheets can go from being simple data containers to powerful tools for analysis and decision-making.
Why is it important to use color coding in Excel?

+
Color coding in Excel helps users quickly identify and differentiate between types of data, enhancing visual understanding and reducing the cognitive load when processing information.
Can I create an Excel dashboard on a mobile device?

+
While you can view and interact with dashboards on a mobile device, designing and setting up complex dashboards is usually best done on a desktop due to the screen real estate and control options available.
What are the benefits of using conditional formatting?

+
Conditional formatting helps to highlight trends, exceptions, or specific conditions within your data, making it easier to spot key insights without manually sifting through the data.
How does grouping data in Excel help with design?

+
Grouping data allows users to collapse or expand sections, providing a cleaner, more organized view of complex datasets, improving both the design and usability of the spreadsheet.
Is mobile optimization necessary for Excel spreadsheets?

+
Yes, with the rise of mobile work, ensuring that your spreadsheets are easily accessible and navigable on mobile devices can improve productivity and accessibility for users on the go.


