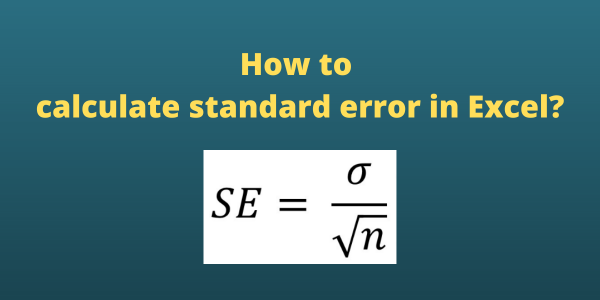
Calculate Standard Error in Excel Easily with These Steps

Understanding the Standard Error

Standard error (SE) measures the variability of a sample statistic such as the mean or proportion from the true population parameter. It's an essential metric in data analysis for understanding the precision of your sample estimate. Here's a simple guide on how to calculate the standard error in Excel:
Step 1: Collect Your Data

First, ensure you have your data ready. Input your dataset into a column or row in Excel. For this guide, let's assume your data is in column A from cell A1 to A100.
Step 2: Calculate the Sample Size

To begin, you need to know the number of data points in your sample, which is:
- Click on an empty cell (say B1).
- Type the formula: =COUNT(A1:A100) to calculate the sample size. Replace A1:A100 with the actual range of your data.
Step 3: Determine the Sample Mean

Next, you'll calculate the average of your sample:
- In another empty cell (let's say B2), enter: =AVERAGE(A1:A100).
- This will give you the mean of your data.
Step 4: Calculate the Sample Standard Deviation

Now, compute the standard deviation of your sample:
- In cell B3, type: =STDEV(A1:A100) to get the sample standard deviation.
Step 5: Compute the Standard Error

To find the standard error, you'll use the formula: SE = Sample Standard Deviation / √Sample Size.
- In an empty cell (like B4), input: =B3/SQRT(B1).
Step 6: Interpret Your Results

The value you see in cell B4 is your standard error. Here's what it means:
- A smaller standard error indicates that your sample mean is more likely to be close to the population mean.
- A larger standard error suggests that your sample might not accurately represent the population mean.
💡 Note: Always ensure your data is clean and relevant for accurate SE calculations. Outliers or irrelevant data can skew your results.
Using Excel's Built-in Functions for SE Calculation

Excel also offers an alternative way to calculate the standard error using the STEYX or STDEV.S functions:
- For STEYX: in an empty cell, type =STEYX(A1:A100, AVERAGE(A1:A100)). Replace A1:A100 with your data range.
- For STDEV.S: type =STDEV.S(A1:A100)/SQRT(COUNT(A1:A100)).
These functions directly compute the standard error but require understanding Excel's data handling nuances.
🔎 Note: The STEYX function provides the standard error of the forecast, so use it only when predicting a y-value for a new x-value.
To summarize the key points discussed above, calculating the standard error in Excel involves:
- Finding the sample size.
- Determining the sample mean.
- Calculating the sample standard deviation.
- Computing the standard error with these values.
Understanding and calculating standard error is crucial for statistical analysis, enabling you to better interpret and communicate the reliability of your sample data.
What does a small standard error indicate?

+
A small standard error indicates that your sample mean is likely to be closer to the true population mean, suggesting higher precision in your sample estimate.
Why is the standard error different from standard deviation?

+
The standard deviation measures the dispersion of individual data points from the sample mean. In contrast, the standard error measures the precision of the sample mean as an estimate of the population mean.
Can I use Excel’s STEYX function to calculate SE for any dataset?

+
No, the STEYX function should only be used for linear regression forecasting and not for general SE calculations where you’re comparing sample statistics to population parameters.
How can I ensure my data doesn’t contain outliers before calculating SE?

+
Use Excel’s data analysis tools like sorting, conditional formatting, or box-and-whisker plots to visually inspect your data for outliers. You can also use the Z-score method for quantitative outlier detection.
Is the standard error related to sample size?

+
Yes, the standard error is inversely proportional to the square root of the sample size. As the sample size increases, the standard error decreases, indicating more precise sample estimates.


