5 Easy Steps to Add Tables in Excel Sheets

Adding tables to your Excel spreadsheets is not just about making your data look more organized. It's about leveraging Excel's powerful features to manage, analyze, and visualize data efficiently. Here, we'll guide you through the essential steps to integrate tables into your spreadsheets, enhancing both the functionality and aesthetics of your data analysis.
Understanding the Basics of Excel Tables

Before you dive into table creation, it’s vital to grasp why using tables in Excel can revolutionize your data management:
- Easier Data Management: Tables allow for structured data handling with filters, sorting, and easy row/column manipulation.
- Improved Calculations: Excel tables support automatic expansion of formulas when new data is added, reducing manual updates.
- Data Visualization: Integrating charts with tables enhances your data presentation for better insights.
Step-by-Step Guide to Adding Tables in Excel

1. Prepare Your Data

Before you create a table, ensure your data is clean and well-organized:
- Remove duplicates, blank rows, or irrelevant data.
- Check for consistent data formatting (e.g., dates, numbers).
- Arrange data in a contiguous block without any blank columns or rows.
2. Select Your Data Range

Click and drag to highlight the dataset where you want to apply the table format:
- Hold down the left mouse button and drag across the cells containing your data.
- Include headers if you have them to make use of Excel’s table sorting and filtering features.
3. Convert Range to Table

Now, convert your selected range into a table:
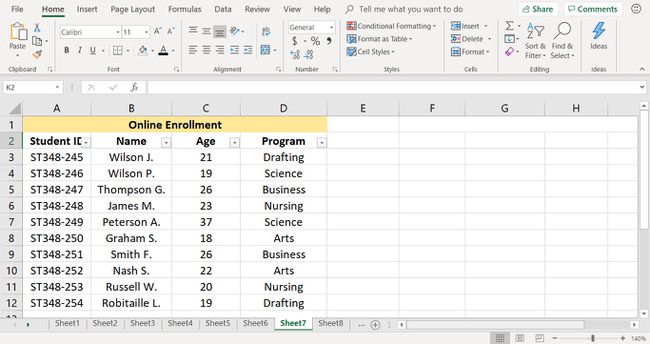
- Go to the “Home” tab in Excel.
- Find the “Format as Table” group. Click on it to reveal table styles.
- Choose a table style that fits your preference or data.
- A dialog box will appear. Ensure the “My table has headers” option is checked if applicable.
4. Customize Your Table

After your table is created, you can adjust various settings:
- Table Style: Use the “Design” tab to change the table’s appearance, such as colors and shading.
- Name: Provide a name for your table under “Properties” for easy reference and structured references.
- Table Features: Enable features like totals rows, filter buttons, and column resizing.
5. Enhance Your Table

Now, leverage Excel’s advanced table features:
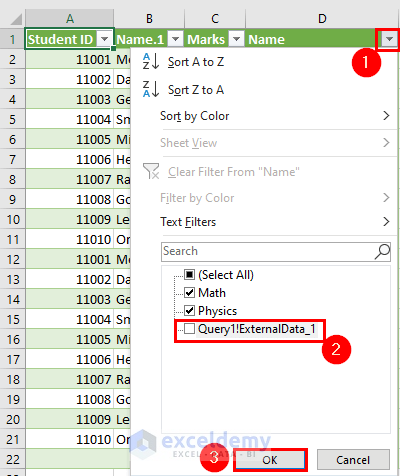
- Sorting and Filtering: Use the dropdown arrows in the header to sort or filter your data for quicker analysis.
- Data Validation: Apply drop-down lists to ensure data consistency.
- Conditional Formatting: Highlight data points visually by setting rules for color, icons, or data bars.
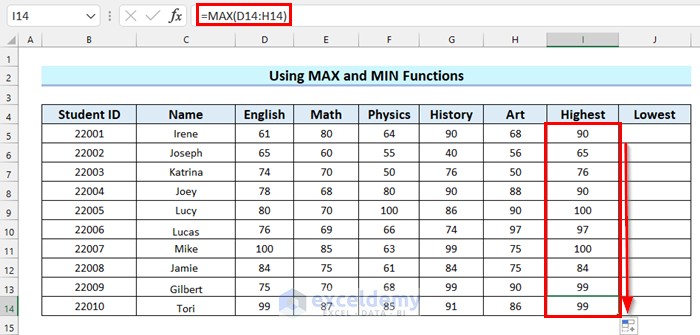
- Calculations: Use Excel’s automatic calculation options to sum up totals or perform other calculations automatically.
💡 Note: Ensure you regularly update your table's references if you insert or delete rows, as this can impact your formulas.
To wrap up, adding tables to your Excel spreadsheets not only organizes data but also unlocks Excel's powerful analytical capabilities. By following these steps, you've learned how to prepare your data, select the appropriate range, convert it into a table, customize it, and then utilize Excel's advanced table features for better data management and analysis. Remember, tables make your work cleaner, more consistent, and significantly more accessible for reporting and decision-making.
What if I don’t see the “Format as Table” option in Excel?

+
Make sure you’re on the “Home” tab. If the option is missing, you might need to upgrade your Excel version, or check if your Excel interface is customized differently.
Can I add more data to my table after it’s created?

+
Absolutely! You can add rows or columns within the table, and Excel will automatically update the table references.
How do I remove a table in Excel without deleting the data?

+
Click on any cell within the table, go to the “Design” tab, and then click “Convert to Range” to remove the table formatting but retain the data.


