5 Ways to Summarize Sheets in Excel Quickly

Excel is renowned for its robust data manipulation capabilities, particularly when it comes to summarizing vast amounts of data efficiently. Whether you're a business analyst, data scientist, or just someone who deals with numbers regularly, knowing how to summarize sheets in Excel can save hours of manual work. Here, we explore five powerful techniques to quickly summarize data in Excel, ensuring your data analysis is both effective and time-efficient.
1. Using the AutoSum Function

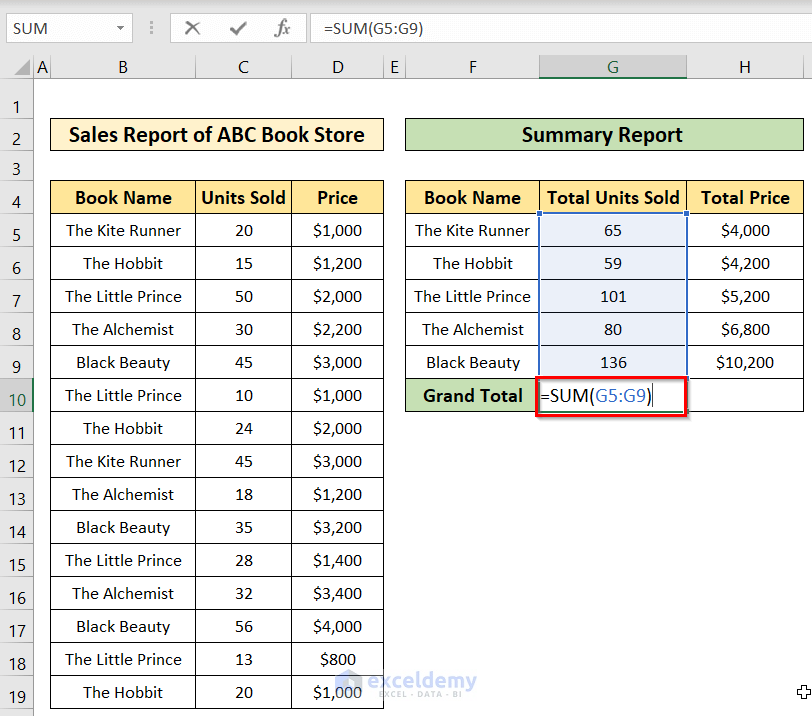
The AutoSum feature in Excel is the simplest tool for quickly totaling rows or columns. Here's how to use it:
- Select the cell where you want the sum to appear.
- Go to the 'Home' tab on the ribbon, click 'AutoSum' in the 'Editing' group, or simply press Alt + =.
- Excel will automatically detect the range of cells to sum up, usually the contiguous numbers above or to the left of the selected cell.
- If the selected range isn't correct, you can manually adjust the range by clicking into the formula and dragging the cell cursor.
2. Pivot Tables for Advanced Summarization

For complex data analysis, Pivot Tables are your best friends in Excel. They can help you summarize, analyze, explore, and present your data in an interactive and customizable way:
- Select your data range or table.
- Go to 'Insert' > 'Pivot Table.'
- In the 'Create PivotTable' dialog box, choose where you want the PivotTable to be placed (new worksheet or existing worksheet).
- Drag fields into the Row Labels, Column Labels, Values, and Filters areas to arrange your summary as needed.
- By default, Excel summarizes numerical data with Sum, but you can change this to Count, Average, Max, Min, etc., from the 'Show Values As' option.
3. Subtotal Function for Grouped Data

The Subtotal function in Excel helps you calculate summaries for groups within your data:
- Sort your data by the column you want to group by (e.g., departments or categories).
- Select the range where you want subtotals to appear.
- Go to 'Data' > 'Subtotal.'
- In the Subtotal dialog box, choose the column for grouping, the function for aggregation (sum, count, average, etc.), and the columns to summarize.
- Click OK, and Excel will add subtotals to each group.
🔎 Note: Remember to sort your data first when using the Subtotal feature, as it only works with grouped data.
4. Using Power Query for Data Summarization

Power Query, part of Excel's Power BI suite, offers advanced tools for data transformation and summarization:
- Go to 'Data' > 'Get Data' > 'From Other Sources' or choose from available data sources.
- Connect to your data source, and Excel will load it into Power Query Editor.
- Here, you can perform steps like grouping, filtering, or aggregating data.
- After setting up your transformations, load the data back into Excel as a new table or append it to existing data.
- Use the 'Group By' feature in Power Query for summarizing data. You can select columns to group, functions to apply, and how to aggregate the data.
5. Custom Functions and Macros for Repetitive Summarization

When dealing with repetitive tasks, custom functions (User Defined Functions or UDFs) or macros can automate data summarization:
- User Defined Functions:
- Open the Visual Basic Editor by pressing Alt + F11.
- Insert a new module and write your function to perform specific calculations or summaries.
- You can then use this function in any cell just like any other Excel function.
- Macros:
- Record a macro of the steps you would take to summarize data.
- Edit the macro for efficiency or custom behavior.
- Run the macro when needed to summarize data quickly.
These techniques ensure that summarizing sheets in Excel becomes a swift and almost effortless task, giving you more time to analyze and interpret the data rather than crunching numbers.
Can AutoSum handle more than just summing up?

+
Yes, AutoSum can also provide Average, Count Numbers, Max, Min, and Product functions through its dropdown menu. However, for complex summarizations, other methods like Pivot Tables or Subtotal might be more suitable.
Do I need to sort data before using the Subtotal function?

+
Yes, data must be sorted based on the column you want to group by. Subtotaling without sorting might lead to incorrect groupings and, consequently, inaccurate summaries.
How can I make my Pivot Table automatically update when new data is added?

+
Ensure your Pivot Table data source refers to a dynamic range or a Table. Dynamic ranges will expand or contract automatically when new data is added, keeping your Pivot Table up-to-date.