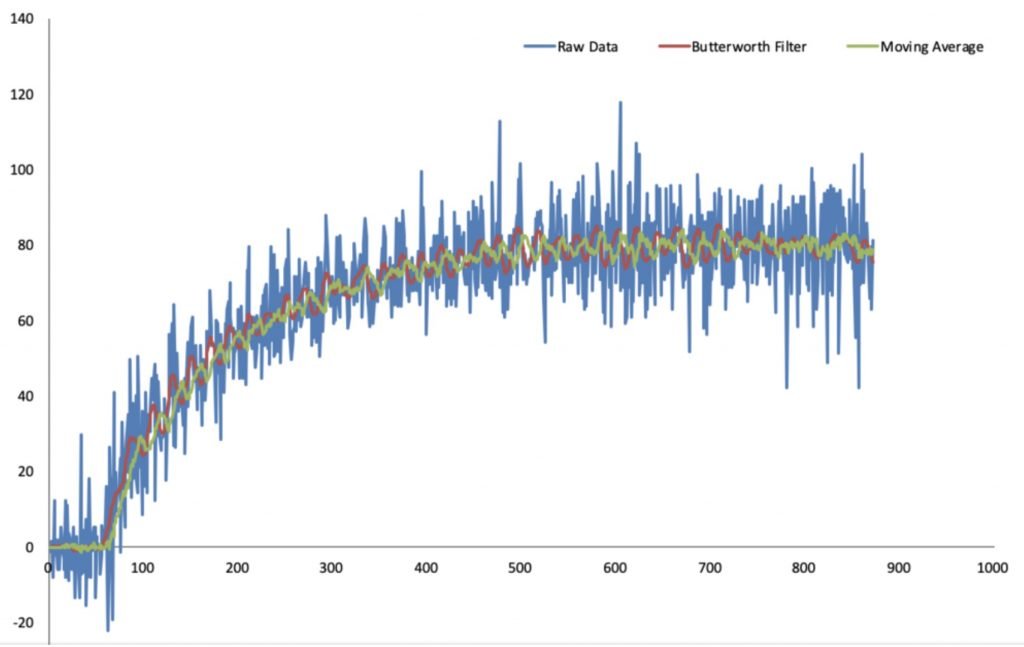
Smooth Excel Data: Moving Average Filter Guide

Dealing with data that has fluctuations or noise is a common challenge in data analysis. Whether you're in finance, analyzing sales trends, or working with any time-series data, you often need a way to identify the underlying trends without getting swayed by short-term volatility. This is where techniques like moving averages come into play, providing a means to smooth out data fluctuations, revealing clearer trends.
What is a Moving Average?

A moving average is a calculation used to analyze data points by creating a series of averages of different subsets of the full data set. It essentially rolls through the data, averaging a specified number of past data points to provide a smoother curve, reducing the impact of erratic jumps and spikes in the data.

Types of Moving Averages

Before diving into the application, let’s explore the two primary types of moving averages:
- Simple Moving Average (SMA) - Calculates the mean of a fixed number of data points (e.g., last 7 days).
- Exponential Moving Average (EMA) - Assigns more weight to recent data, thus being more responsive to new information.
Implementing Moving Averages in Excel

Excel provides several straightforward methods to apply moving averages to your data. Here’s how you can do it:
Using Data Analysis Toolpak

To use Excel’s Data Analysis Toolpak:
- Enable the Data Analysis Toolpak:
- Go to File > Options > Add-Ins.
- Select "Analysis ToolPak" and click "Go."
- Check the box for "Analysis ToolPak" and OK.
- Open your data sheet.
- Go to Data > Data Analysis > Moving Average.
- Fill in the input range, set the interval, and choose where to output the results.
- Click OK.
Using Excel Functions

Alternatively, you can use Excel formulas:
- Select the cell where you want the first average to appear.
- For an SMA with a 7-day period, use the formula:
=AVERAGE(B2:B8), assuming your data starts in cell B2. - Drag the formula down to auto-fill.
💡 Note: For EMA, you would first calculate the SMA and then adjust each subsequent value with the formula: =((Current Value - Previous EMA) * (2 / (Time Period + 1))) + Previous EMA.
Visual Representation

Once you have your smoothed data:
- Select your raw and smoothed data.
- Insert > Chart > Line.
- Format the chart to differentiate between the original and smoothed lines.

Benefits of Using Moving Averages in Excel

- Trend Identification - Highlights underlying trends by reducing noise.
- Data Smoothing - Removes short-term fluctuations to show a clearer picture.
- Forecasting - Can be used to predict future trends based on historical data.
- Simple to Implement - Easy to apply even if you’re not a data expert.
Considerations and Limitations

While moving averages are powerful, they come with certain caveats:
- Lag - They can lag behind real-time data, especially SMA.
- Data Volume - Requires sufficient data points to be effective.
- Type of Data - Not suitable for all datasets; it depends on the data's nature and the analysis goal.
🔔 Note: Moving averages can smooth out your data, but they do not interpret the cause of trends or predict turning points; they merely follow the existing data pattern.
To wrap things up, applying moving averages in Excel can significantly enhance your data analysis, providing clearer insights into trends and patterns. By understanding how to implement both simple and exponential moving averages, you can effectively remove noise from your datasets, facilitating better decision-making in various fields. Remember that while moving averages can smooth out your data, they are just one of many tools in data analysis, and their effectiveness depends on proper application and the context of your data.
What is the difference between SMA and EMA?

+
SMA calculates the average of a set number of periods, whereas EMA gives more weight to recent data, making it more responsive to changes. EMA might pick up trends quicker than SMA but could also be more sensitive to outliers.
Can I use moving averages for any type of data?

+
Moving averages work best with time-series data where there’s a clear temporal pattern. For other data types, it might not yield meaningful results, especially if the data lacks a clear sequence or has irregular gaps.
How does the choice of period length affect the moving average?

+
A shorter period length will make the moving average more responsive to changes in the data, showing less lag but potentially more noise. A longer period will smooth the data more, reducing noise but increasing the lag in trend detection.