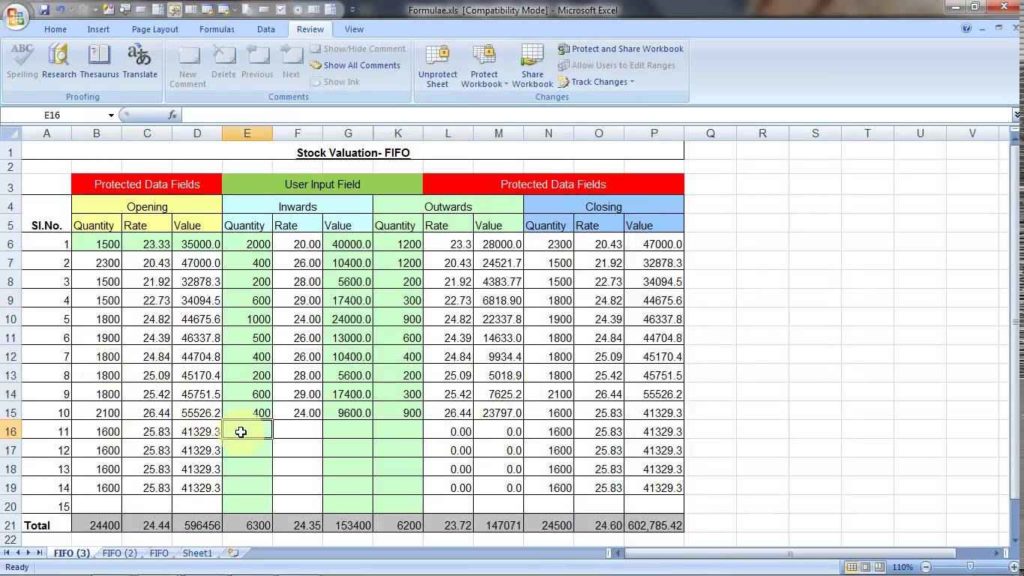
Unlock Excel Data: Easy Reading Techniques

Introduction to Excel Data Reading

Excel is a powerful tool for data analysis, but when dealing with large datasets, navigating through the information can be daunting. This blog post will guide you through various techniques to easily read and understand data in Microsoft Excel, enhancing your productivity and accuracy in data interpretation.

Understanding the Structure of Excel Data

Before diving into specific techniques, let's briefly review how data is typically organized in Excel:
- Rows: Represent records or items.
- Columns: Show categories or attributes of those records.
- Cells: The intersection of a row and column where data resides.
Knowing this structure will help you apply the following techniques effectively.
Basic Data Reading Techniques

1. Freeze Panes

When dealing with extensive spreadsheets, you often lose track of headers as you scroll down or sideways. Here’s how to keep headers in view:
- Select the row below the header or the column to the right where you want to freeze the panes.
- Go to the View tab, select Freeze Panes, and choose the appropriate option.
🖊️ Note: This feature can save time by eliminating the need to scroll back to the top to remember column names.
2. Use Conditional Formatting

Conditional formatting helps highlight important data points or trends:
- Select the data range.
- Navigate to the Home tab, click on Conditional Formatting, and choose rules or create a custom rule.
Examples include highlighting cells that meet specific criteria, like:
- Top/Bottom Rules (e.g., highlight top 10% of values).
- Data Bars for a visual representation of value magnitude.
- Color Scales to visualize data distribution.
Advanced Techniques for Deeper Insights

3. Data Validation for Efficient Entry and Filtering

Data Validation allows you to control what can be entered into a cell, ensuring data consistency:
- Select the cell(s) where you want to apply the validation.
- Go to the Data tab, select Data Validation, and set up the rules.
- Enable the dropdown list to guide users in data entry.
This feature not only ensures data integrity but also makes filtering or sorting data more straightforward.
4. Subtotaling for Group Summaries

When you have a list that needs to be summarized by groups, subtotaling is your best bet:
- Sort your data by the column you want to group by.
- Select Subtotal from the Data tab.
- Choose the function (SUM, COUNT, etc.), select the group by field, and add function details.
📊 Note: Subtotal provides a quick way to see group statistics without manually aggregating data.
5. PivotTables for Data Exploration

PivotTables are the powerhouse for summarizing, analyzing, and presenting large datasets:
- Select your data.
- Go to the Insert tab and click PivotTable.
- Drag fields into rows, columns, values, or filters to customize your data view.
Here’s a quick example:
| Region | Product | Sum of Sales |
|---|---|---|
| North | Gadget A | 5,000</td> </tr> <tr> <td>East</td> <td>Gadget B</td> <td>3,000 |

Conclusion

Learning to effectively read and interpret data in Excel can dramatically increase your productivity and decision-making capabilities. Techniques like freezing panes, conditional formatting, data validation, subtotaling, and pivot tables provide various methods to manage and analyze data. With these tools, you can turn overwhelming datasets into manageable, insightful information.
What is the best way to freeze panes in Excel?

+
The best practice is to freeze panes just below the header row or to the right of the column containing key identifiers like names or dates, ensuring easy reference while scrolling through your data.
Can I use conditional formatting to identify trends in large datasets?

+
Yes, conditional formatting can highlight patterns or anomalies by changing cell colors, adding data bars, or using color scales to visualize data distribution.
How does data validation help in managing large Excel files?

+
Data validation ensures data consistency, reducing errors in entry and making sorting and filtering much easier since the data follows specific rules.