5 Simple Ways to Add Lines in Excel Sheets

When working with Excel spreadsheets, you might often find yourself needing to organize and structure data visually to make it more readable and to enhance its professional appearance. Adding lines in Excel can help you achieve this by clearly demarcating data sets, totals, and sections. Here, we'll explore five simple ways to add lines in Excel sheets, each serving different purposes for both functionality and aesthetics.
1. Using Borders

The simplest and most direct method to add lines in Excel is by using borders. Borders can frame your data, separate headers from content, or simply provide a visual boundary for different sections:
- Select the cells where you want to add borders.
- Go to the Home tab, under the Font group, click on the border icon.
- Choose from All Borders, Top Border, Bottom Border, Left Border, Right Border, or any other border style you prefer.
You can also customize the line style, color, and thickness for borders to suit your needs.
📌 Note: Borders are excellent for creating visual structure without altering data or layout significantly.
2. Inserting Lines via Format Cells

Another approach to adding lines involves the Format Cells dialog box, which offers more detailed control over borders:
- Right-click on the selected cells or range, then select Format Cells.
- In the dialog box, navigate to the Border tab.
- Here, you can choose the line style, color, and where you want the lines to appear around the selected cells.
This method is particularly useful for creating custom gridlines or for outlining specific sections of your spreadsheet.
3. Using Drawing Tools for Decorative Lines

For a more decorative or flexible approach, you can utilize Excel’s drawing tools:
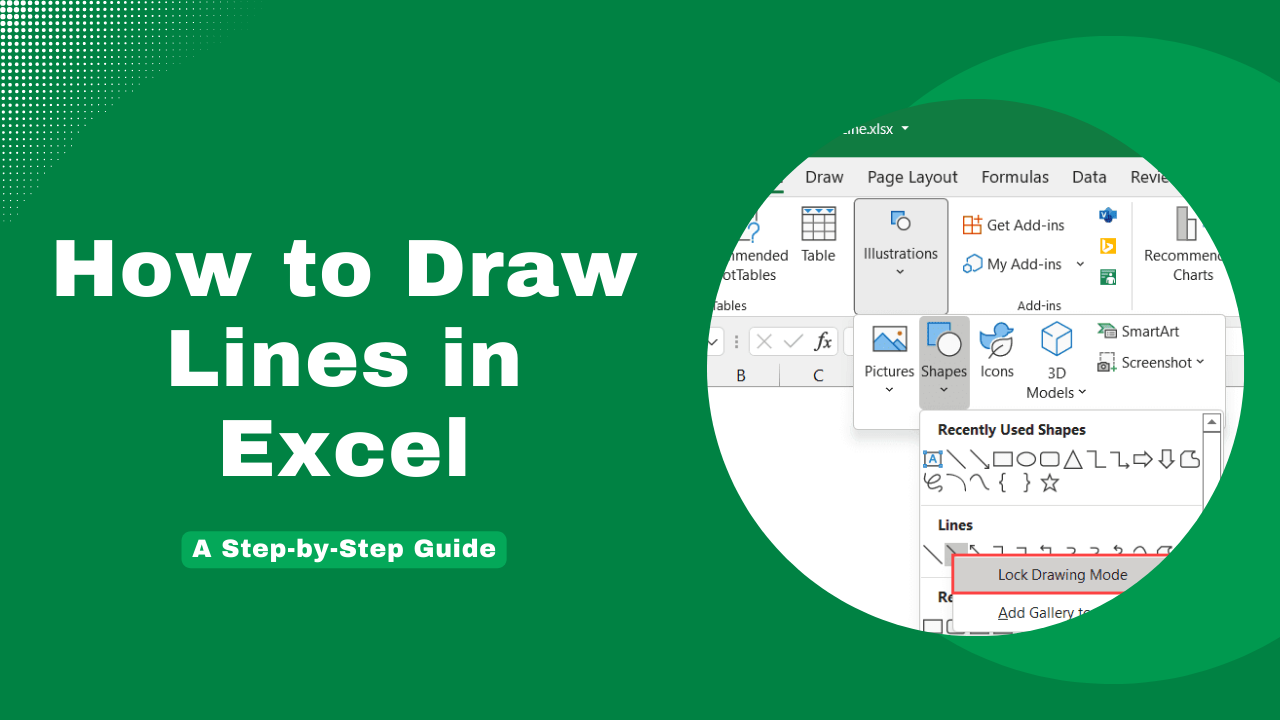
- Go to the Insert tab and click on Shapes.
- Choose the line type you want (e.g., straight line, arrow, etc.).
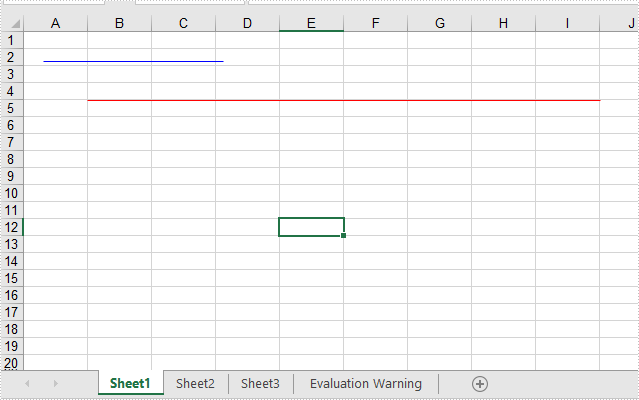
- Draw the line on your spreadsheet, adjusting its length and position as needed.
This method allows for lines to be drawn freely, which can be particularly useful for adding visual aids or separators that don’t conform to cell borders.
4. Printing Gridlines

If you’re looking to print your Excel sheet, you might want to include gridlines for better readability:
- Go to Page Layout tab.
- Check the box for Print under Gridlines.
These lines are not part of the cell content but are visible when the sheet is printed or viewed in Page Layout view.
5. Adding a Line Chart Series

For a more technical representation, you can add a line chart series to your data:
- Select your data.
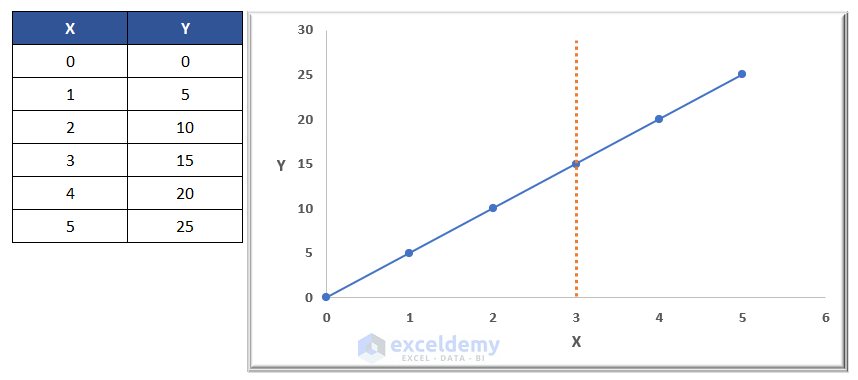
- Insert a Line or XY (Scatter) chart.
- Adjust the series to represent your data points with lines connecting them.
While not exactly “lines” as used for demarcation, this method uses lines to visualize trends or patterns in your data, making it both functional and informative.
In summary, adding lines in Excel can serve various purposes from visual structuring to data analysis. Whether it's for clarity, aesthetics, or data visualization, Excel provides versatile tools to accomplish this:
- Borders for standard line additions.
- Format Cells for detailed control over line placement.
- Drawing tools for flexible, decorative lines.
- Printing gridlines for printed documents.
- Line charts for data visualization.
The method you choose depends on what you're aiming to achieve with your spreadsheet, whether it's for better organization, presentation, or data analysis. Each technique offers different levels of customization and visibility, catering to both the aesthetic and functional needs of your Excel work.
What is the difference between borders and gridlines?

+
Borders are user-defined lines that can be applied to individual cells or ranges to separate or highlight data. Gridlines, on the other hand, are faint lines that are always present in the spreadsheet grid for better cell orientation and are controlled by Excel’s view settings.
Can I remove lines from my Excel sheet?

+
Yes, you can remove borders by selecting the cells and choosing ‘No Border’ from the border options. Gridlines can be turned off or on from the ‘Page Layout’ or ‘View’ tab.
How do I change the color of lines in Excel?

+
To change the color of borders, go to the ‘Format Cells’ dialog box, select the ‘Border’ tab, and choose your color. For drawing tools lines, select the line and use the format options to change the color.
Can I make a line chart from Excel data?

+
Yes, by selecting your data, inserting a line or XY (Scatter) chart, you can visualize trends or relationships in your data with lines connecting data points.
Do these line additions affect the functionality of Excel formulas?

+
No, adding lines through borders, gridlines, or charts does not impact the functionality or calculation of Excel formulas. They are purely for visual aid.