Master Monthly Balance Sheets in Excel Easily

Managing a monthly balance sheet in Excel doesn't have to be complicated. With the right strategies and tools, you can efficiently track your finances, monitor business performance, and ensure your financial health is in check. This guide will help you master monthly balance sheets using Excel, with easy-to-follow steps and practical tips for both beginners and seasoned users.
Why Excel for Monthly Balance Sheets?

Before diving into the "how", let's understand the "why" behind using Excel for balance sheets:
- Flexibility: Excel is highly adaptable, allowing for customization of financial templates to suit any business's needs.
- Computation Power: Excel's formula capabilities make quick work of calculations, reducing the risk of manual errors.
- Data Analysis: Features like pivot tables and charts help in extracting meaningful insights from your financial data.
- Universal Accessibility: Being a widely used tool, collaboration with others is straightforward.
Setting Up Your Excel Balance Sheet

1. Start with the Template

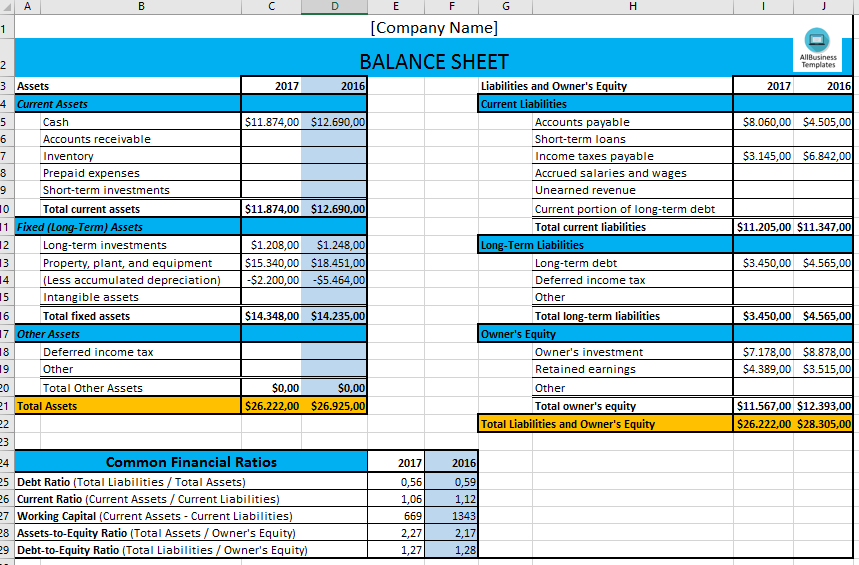
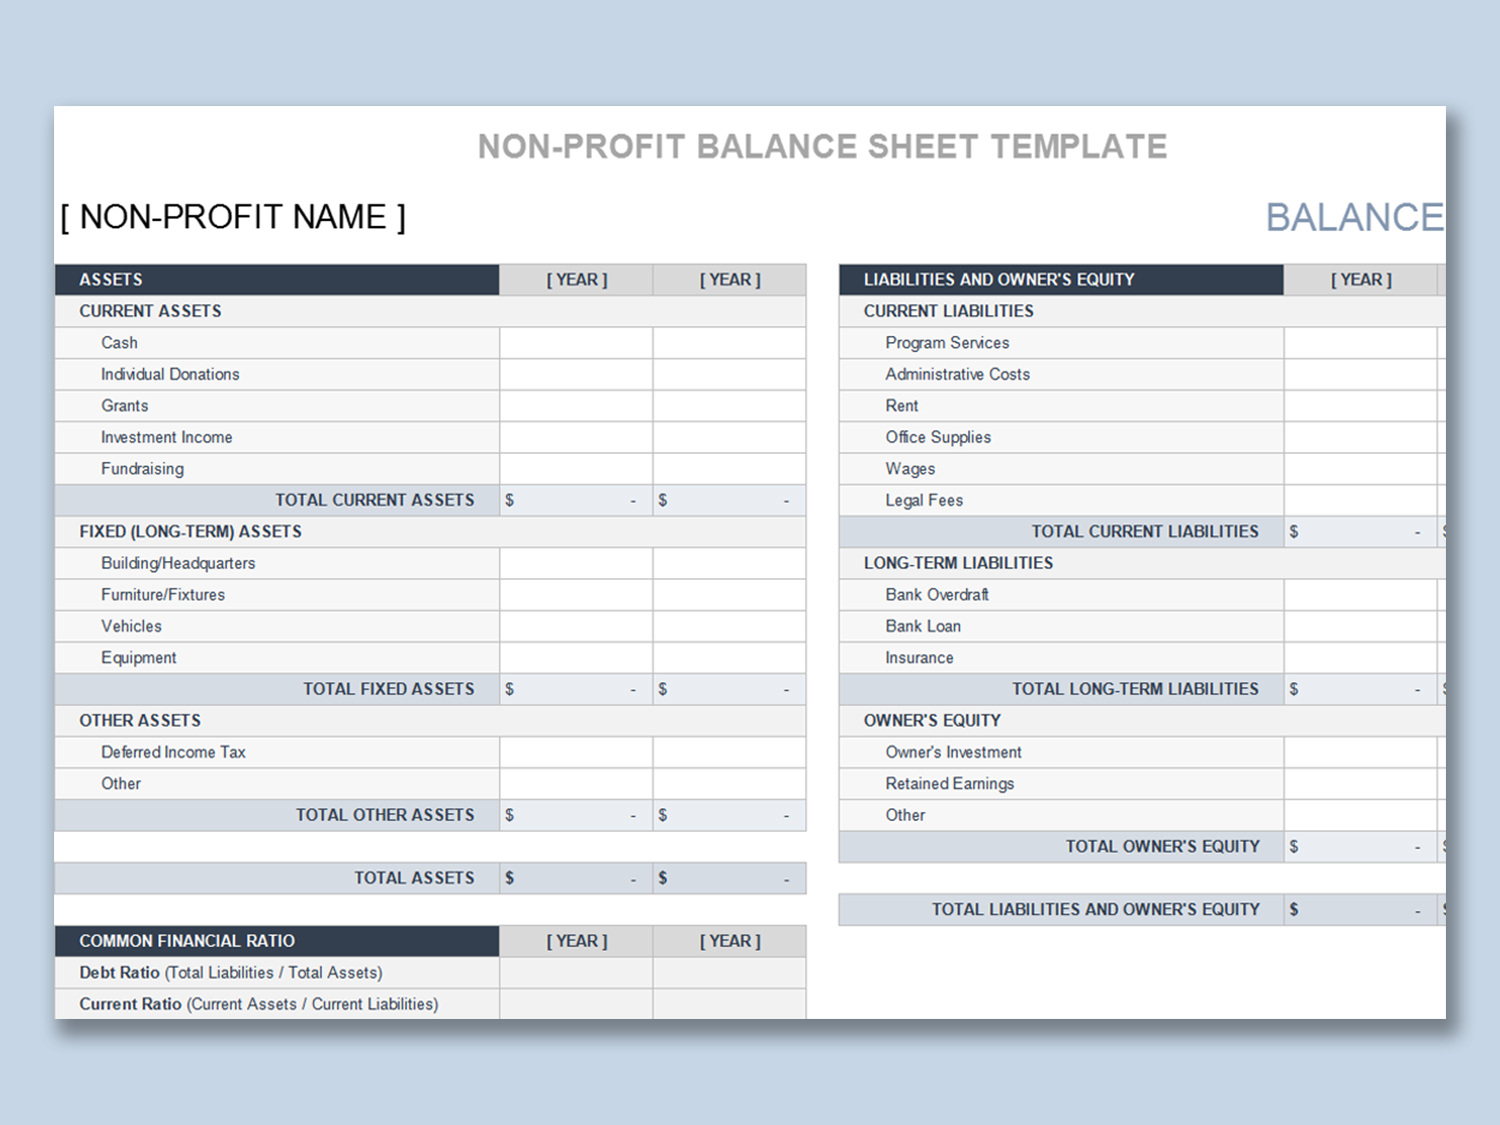
Start by downloading or creating a basic balance sheet template. Here is a simple table structure:
| Assets | Liabilities | Equity |
|---|---|---|
| Cash | Accounts Payable | Owner’s Equity |
| Accounts Receivable | Short-term Loans | |
| Inventory | Long-term Debt | |
| Total Assets | Total Liabilities | Total Equity |

⚙️ Note: You can modify this template to include or exclude categories relevant to your business operations.
2. Input Your Data

Begin by inputting your financial data:
- Add your assets in the left column, including cash, accounts receivable, and inventory.
- Detail your liabilities on the right, like accounts payable or loans.
- Equity can be either positive (owner’s investment) or negative (business losses).
🔍 Note: Ensure data accuracy by reviewing records from your accounting software or financial statements.
3. Calculations and Formulas

Excel shines with its formulas. Here are the key ones:
- Total Assets: =SUM(A1:A10)
- Total Liabilities: =SUM(B1:B10)
- Total Equity: =C1 - B11
- Balance Check: =IF(Total Assets = Total Liabilities + Total Equity, “Balanced”, “Unbalanced”)
📏 Note: Always check if your balance sheet is balanced using this simple formula. If not, review your entries.
4. Formatting and Presentation

Make your balance sheet visually appealing and easy to understand:
- Use conditional formatting to highlight positive and negative values differently.
- Apply number formatting to your cells to display currency values correctly.
- Create borders and headers for improved readability.
5. Monthly Updates and Analysis

To manage your finances effectively:
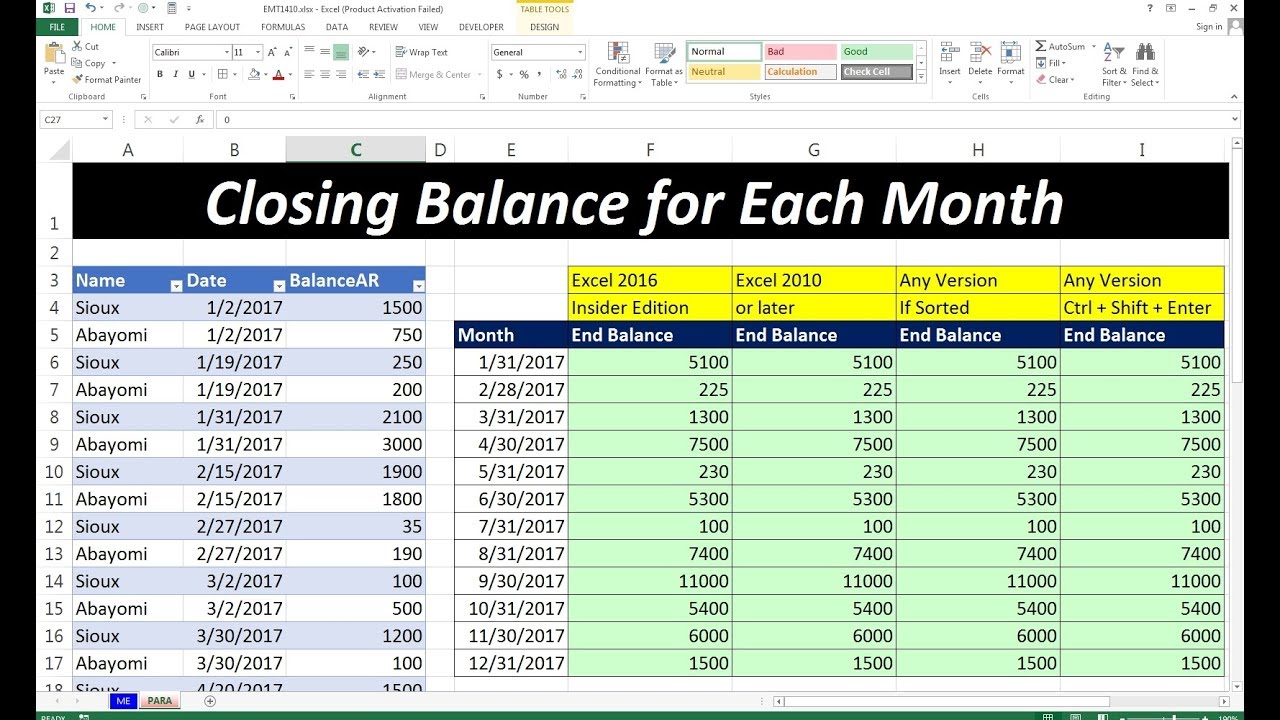
- Regularly update your balance sheet at the end of each month.
- Compare previous months to understand trends and financial health.
- Use Excel’s analytical tools for deeper insights into financial performance.
By mastering these steps, you’ll be well-equipped to manage your monthly balance sheet with ease and accuracy. Excel’s tools make it simple to keep track of your financial health, allowing you to make informed business decisions. Remember to keep updating and reviewing your balance sheet to ensure it reflects the most current financial data, providing you with actionable insights to guide your company towards financial stability and growth.
How often should I update my balance sheet in Excel?

+
It’s best practice to update your balance sheet monthly to keep an accurate financial pulse on your business. However, if significant changes occur, you might consider updating it more frequently.
What if my balance sheet doesn’t balance?

+
If your balance sheet shows as “Unbalanced,” there are likely errors in your input or calculations. Review:
- Ensure all entries are correct and up-to-date.
- Check for any omitted transactions or incorrect asset/liability categorization.
- Verify that your formulas are correctly applied.
Can Excel help me make financial forecasts?

+
Yes, Excel is powerful for financial forecasting:
- Use trend analysis functions like FORECAST or use regression analysis.
- Create scenarios with the ‘What-If Analysis’ tool to model different business outcomes.