5 Easy Steps to Place a Chart on a New Excel Sheet

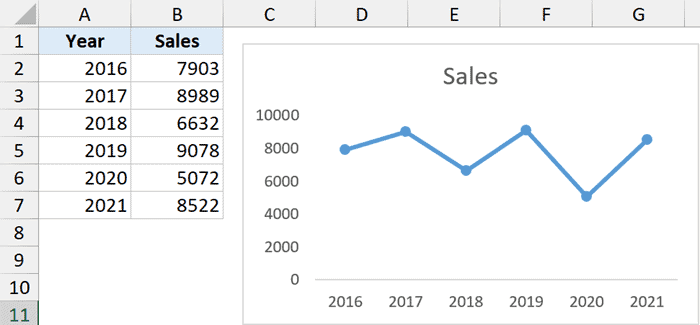
Creating charts in Microsoft Excel can transform your raw data into visual narratives that are easier to understand, analyze, and present. When working with large datasets or complex information, it often becomes necessary to segregate your charts for clarity and presentation purposes. Here’s how you can place a chart on a new sheet in Excel with just a few simple steps:
Step 1: Select Your Data

The first step to placing a chart on a new sheet in Excel is selecting the data you wish to visualize:
- Click and drag to highlight the cells containing the data you want to chart.
- Ensure your data includes headers for both columns and rows to provide context for your chart.
Step 2: Insert the Chart

Once your data is selected:
- Go to the Insert tab on the Excel ribbon.
- Choose the chart type from the Charts group. Common types include Column, Line, Pie, Bar, Area, and more.
- Select your desired chart style by clicking on it. Excel will automatically generate a chart on your current sheet.
Step 3: Move the Chart to a New Sheet

To move your newly created chart to a new sheet:
- Right-click on the chart.
- Select Move Chart from the context menu.
- In the dialog box that appears, choose New sheet and provide a name for your chart sheet if desired.
- Click OK.
Step 4: Customize Your Chart

After moving your chart to a new sheet:
- You can now customize your chart as needed, adjusting elements like:
- Titles, axes labels, and legends for clarity.
- Colors, styles, and themes for visual appeal.
- Data series or chart type to better represent your data.
Step 5: Review and Share

Once your chart is created and customized:
- Review it for accuracy and ensure all data points are correctly depicted.
- Use Excel’s sharing options or export features to collaborate or present your chart. You can save the file as a PDF, print it, or share it through cloud services.
By following these steps, you ensure that your charts are not only informative but also visually distinct and easy to navigate.
🚀 Note: When moving charts, ensure you keep the link to the data intact so your chart updates dynamically with changes in the data source.
🌟 Note: If you encounter any issues with chart placement or sizing, try adjusting the sheet size or view to better fit your chart.
These five simple steps allow you to organize and present your data in a clear and professional manner. Whether you're creating reports, presenting to stakeholders, or just keeping your data organized, placing charts on new sheets in Excel makes it easier to focus on key trends and insights, enhancing your analysis process and making your data more digestible.
Can I link multiple charts to the same data?

+
Yes, you can create different types of charts or views of the same dataset by copying the data range or linking charts to a single data source.
How do I update a chart when the underlying data changes?

+
Charts in Excel are dynamic. When you update the data, the chart automatically reflects these changes, as long as the chart is linked to the data correctly.
What are some tips for making my chart visually appealing?

+
Use consistent color schemes, avoid overly complex charts, ensure readability of text, and employ chart elements like legends and axis titles wisely for better understanding.


