Organize Your Excel Sheet by Color Easily

In the world of data management, Microsoft Excel stands out as a powerful tool for organizing and analyzing information. However, when datasets grow large, it becomes crucial to implement efficient methods to navigate through your data. One visually effective technique is color coding. While Excel provides basic color-coding options, to enhance this feature, you can follow these steps and tips to organize your Excel sheet by color effortlessly.
Why Color Code Your Excel Sheet?
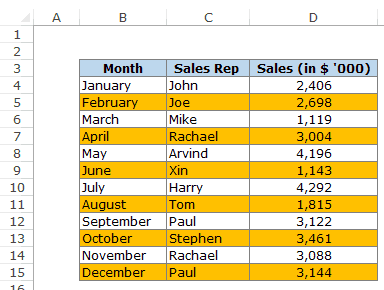
- Improved Data Accessibility: Colors help distinguish between different categories, making data easier to scan and understand at a glance.
- Quick Data Sorting: With color-based sorting, you can segregate and analyze data more efficiently.
- Error Reduction: By visually segmenting data, the chance of misinterpreting or overlooking information decreases.
- Visual Appeal: Well-organized, colorful spreadsheets can be more engaging and less intimidating for users.
Step-by-Step Guide to Color Code Your Excel Sheet
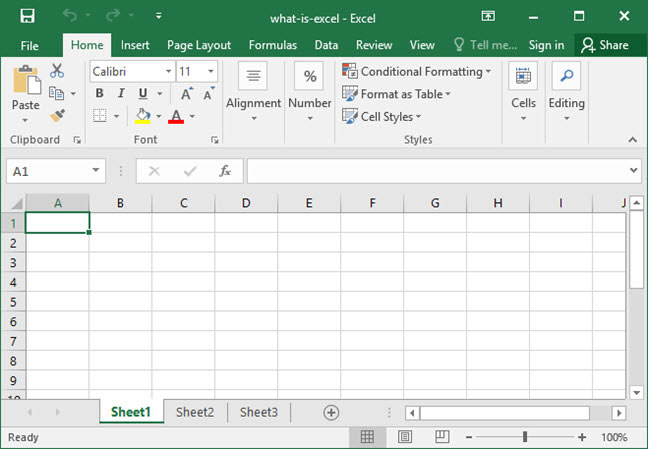
1. Selecting Data for Color Coding

First, decide what information you want to highlight with colors:
- Categories or types of data
- Numeric thresholds (e.g., values above or below a certain number)
- Project phases or statuses
2. Applying Color Codes

Follow these steps to manually or automatically apply colors:
Manual Color Coding
- Select the cells or range you want to color.
- Right-click, choose ‘Format Cells’, then the ‘Fill’ tab.
- Select your desired color from the palette.
Conditional Formatting
- Go to ‘Home’ tab > ‘Conditional Formatting’.
- Select ‘New Rule’ for custom rules or predefined options like ‘Top/Bottom Rules’.
- Set up your criteria (e.g., “Cell Value > 50” or “Text contains ‘Complete’”).
- Choose a format, specifying a fill color.
3. Sorting by Color
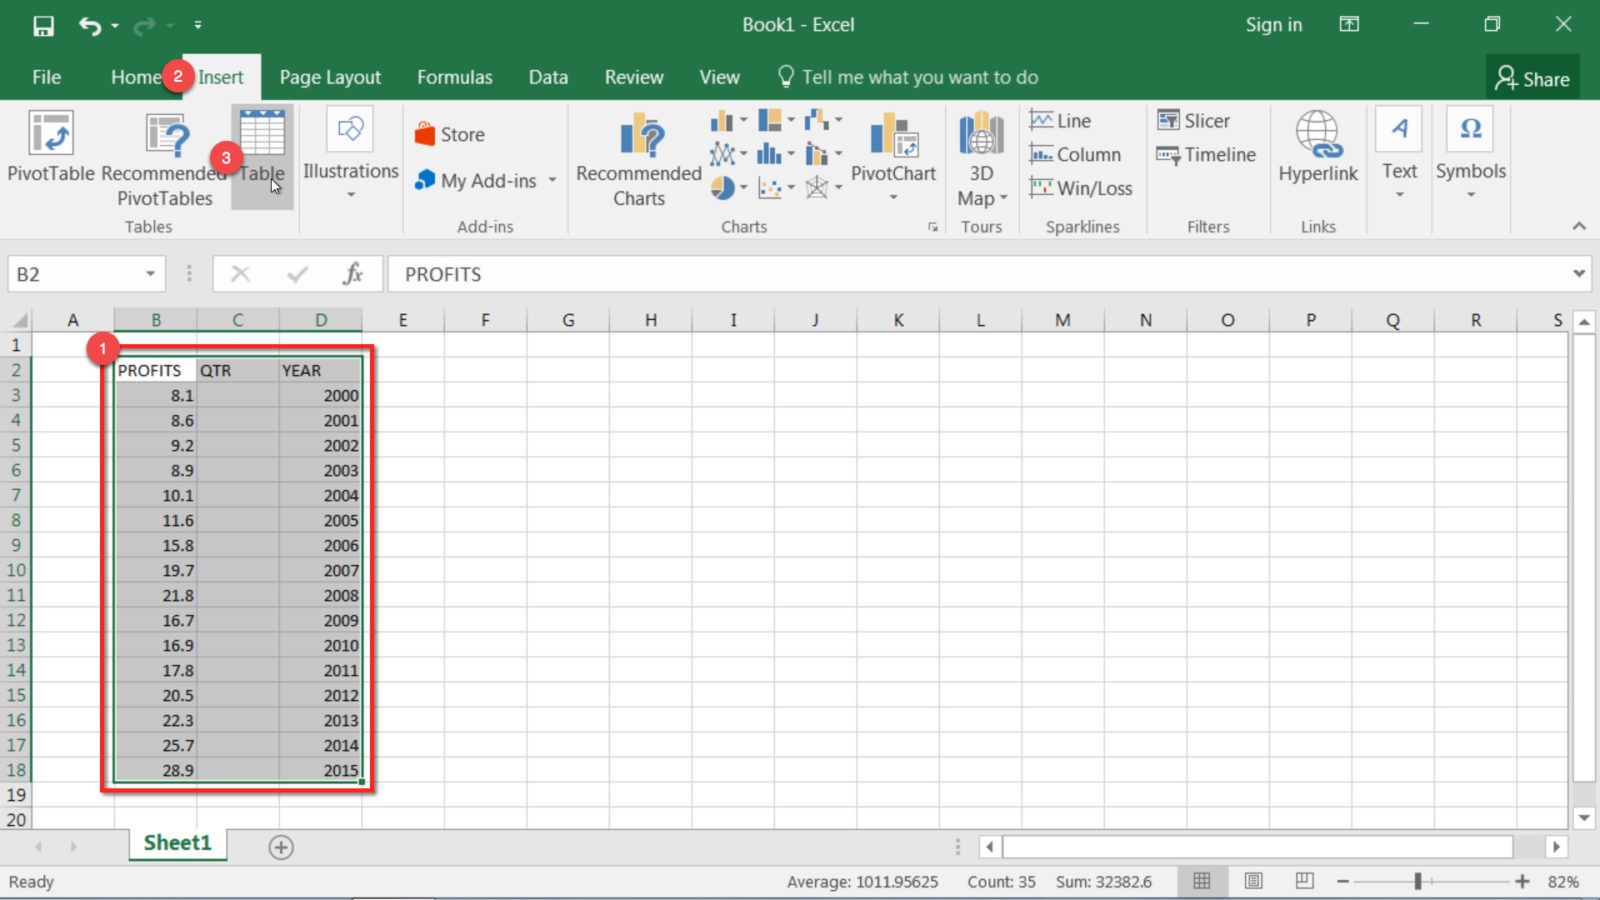
Once you’ve color-coded your data, sorting by color can help in data analysis:
- Select your data range or entire column.
- Go to ‘Data’ tab > ‘Sort & Filter’ group > ‘Sort’.
- In the ‘Sort’ dialog, choose ‘Sort On’ > ‘Cell Color’ and pick the color you want to prioritize.
4. Using Named Ranges for Easier Reference

Named ranges make referencing color-coded data in formulas or charts simpler:
- Select the colored range.
- Go to ‘Formulas’ tab > ‘Define Name’.
- Give it a meaningful name like ‘HighPriority’, ‘DoneTasks’, etc.
5. Creating a Color Legend

Add a legend to guide users through your color-coded system:
- Use a separate cell or area at the top or side of your sheet.
- Fill cells with your chosen colors, then label each with the corresponding category or information.
👨💻 Note: Remember, too many colors can confuse users, so keep your color palette simple and intuitive.
6. Maintaining Your Color Coding

Keeping your color system consistent and up-to-date is key:
- When adding or editing data, ensure it follows your established color scheme.
- Regularly review and update your color coding to reflect changes in data or project status.
- Document your color coding system within your workbook, or use cell comments to explain the color significance.
To make the most out of color coding in Excel, consider these additional tips:
- Use Color Sets: Excel provides predefined color sets that can be applied to bar charts, cells, or other data visualizations for quick color assignments.
- Customize Views: You can create custom views in Excel that include color filters, allowing you to switch between different data views effortlessly.
- Use Formulas for Dynamic Color Coding: Instead of manually applying colors, use formulas like
=IF(A1="Complete",TRUE,FALSE)combined with conditional formatting to automate the process.
📊 Note: For large datasets, use conditional formatting rules to apply colors, as manual color coding can be time-consuming.
In summary, by implementing color coding in your Excel sheets, you transform raw data into an interactive, visually organized format that significantly enhances data comprehension and management. This approach not only improves the user experience but also ensures that your data is presented in a manner that facilitates analysis, decision-making, and error reduction. Through the steps outlined above, you've equipped yourself with a set of tools to navigate your spreadsheets with ease and efficiency.
Can I color-code cells based on cell content?

+
Yes, you can use Excel’s conditional formatting to color cells based on their content, such as text, numbers, or dates.
What if I want to change the colors later?
+
You can easily edit the colors in the ‘Format Cells’ dialog or by modifying conditional formatting rules at any time.
How many colors should I use?
+
Limit your color usage to maintain clarity. A palette of 5-7 colors is generally sufficient to categorize data without overwhelming the viewer.
Will color coding affect performance in large spreadsheets?

+
While color coding doesn’t significantly impact Excel’s performance, excessive conditional formatting rules can slow down processing in very large datasets.