5 Ways to Style and Organize Excel Sheets

The organization and styling of Excel sheets are pivotal for users across diverse sectors, enhancing not only the readability of data but also its effective communication and accessibility. Whether you're managing large datasets, creating a financial report, or tracking project progress, a well-structured Excel sheet can significantly boost productivity and clarity. Here, we delve into five effective strategies to achieve a professional look and a highly functional setup in your Excel spreadsheets.
1. Use of Color Coding

Color coding is a fundamental method to make your Excel spreadsheets visually appealing and easier to navigate. Here are some ways to implement it:
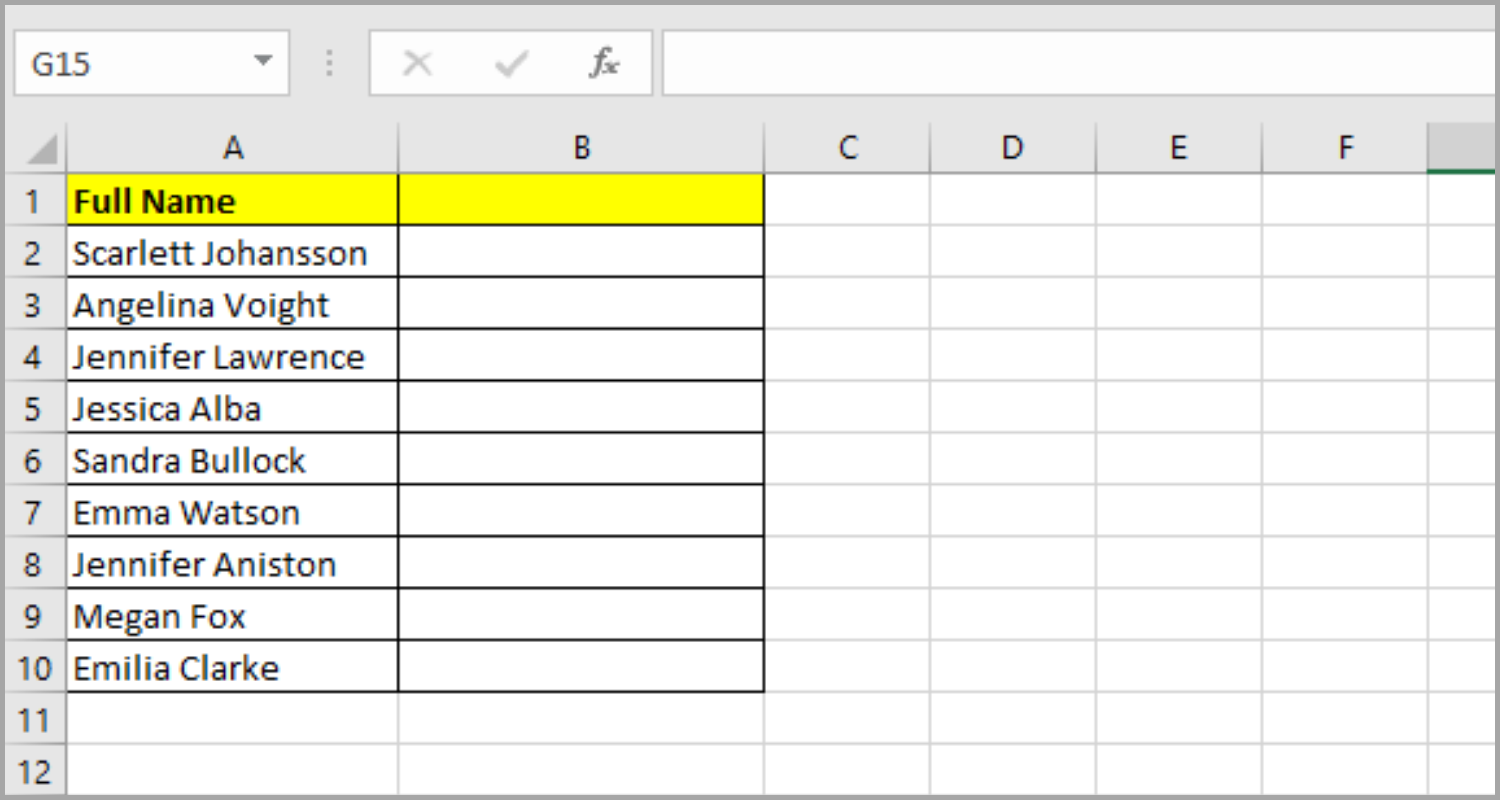
- Headers and Titles: Use distinct colors for headers and titles to differentiate them from data rows immediately.
- Data Categories: Assign colors to various categories to help users quickly identify different types of data. For instance, use green for profits, red for losses.
- Highlighting Important Information: Use bold colors or special formats like conditional formatting to highlight critical cells or ranges.
🔖 Note: Ensure the colors you choose are colorblind-friendly to maintain accessibility for all users.
2. Implementing Data Validation

Data validation rules can help maintain data integrity and user-friendliness in your spreadsheets:
- Dropdown Lists: Create lists to ensure data entry is consistent and within predefined parameters.
- Input Messages: Set up messages that appear when users enter data into cells, providing instructions or additional context.
- Error Alerts: Configure custom error messages to guide users when incorrect data is entered.
3. Conditional Formatting

Conditional formatting dynamically applies styles based on the cell's value, making it easier to spot trends, outliers, or specific conditions at a glance:
- Highlight Cell Rules: Apply rules to change color based on values, like highlighting cells with values greater than a specific threshold.
- Data Bars, Color Scales, and Icon Sets: Use these visual tools to represent data in a more accessible format.
- Formula-Based Rules: Create rules using formulas to format cells based on complex conditions.
📌 Note: Use conditional formatting judiciously to avoid overwhelming the reader with too much color or visual noise.
4. Utilizing Tables

Excel tables offer a structured way to manage data, providing numerous benefits:
| Feature | Benefit |
|---|---|
| Auto-Expanding Columns | Automatically adjusts to include new data. |
| Sorting and Filtering | Easy manipulation of data views. |
| Consistent Formatting | Maintains a uniform look across the dataset. |
| Calculated Columns | Formulas applied to new entries automatically. |

5. Freeze Panes and Split Screens

To ensure continuous visibility of headers or key columns:
- Freeze Panes: Keep row and column headers visible while scrolling.
- Split Screens: Divide the window into multiple panes, each with its own scrollability, allowing simultaneous viewing of different sections of the spreadsheet.
Effective use of these five techniques will transform your Excel sheets into well-organized, visually appealing, and highly functional data management tools. By applying color coding, data validation, conditional formatting, using tables, and managing screen viewability, you'll not only enhance the presentation of your data but also facilitate better data analysis and decision-making.
With these styling and organizational strategies at your disposal, your Excel sheets will not only look professional but will also function at an optimal level. Whether you're dealing with large datasets, financial reports, or project management tasks, these tools will help you present data in a more meaningful way, ultimately leading to improved productivity and better-informed decisions.
How can I apply conditional formatting effectively without cluttering the sheet?

+
To avoid clutter, use conditional formatting sparingly. Highlight only the most critical data points or conditions, and select colors that are subtle yet distinguishable. Also, consider using icon sets or data bars that do not obscure the actual data.
What should I do if my Excel sheet has too many colors?

+
If your sheet becomes visually overwhelming due to excessive use of color, consider using a more muted color palette, reducing the number of color-coded elements, or using conditional formatting only for key data analysis.
How do tables improve data handling in Excel?

+
Tables in Excel provide structured references, auto-expanding capabilities, and easier sorting and filtering, which greatly enhance the usability and organization of data, making it more manageable for analysis and presentation.
Can I freeze panes for only certain rows or columns?

+
Yes, you can freeze specific rows or columns by selecting the cell below or to the right of the rows/columns you want to freeze and then choosing ‘Freeze Panes’ from the ‘View’ tab.