5 Simple Steps to Move Excel Graph to New Sheet

Mastering the art of managing Excel spreadsheets, especially when dealing with graphical data, can significantly boost your productivity. Often, while working on large datasets, you might find it necessary to relocate a graph to a new sheet for better organization or presentation purposes. Here, I'll walk you through five simple steps to seamlessly move an Excel graph to a new sheet, enhancing your data visualization experience.
Step 1: Select Your Chart

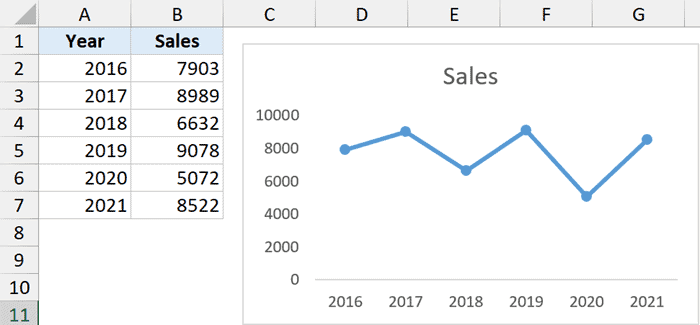
The first step in moving a chart to a new sheet is to locate and select it. Navigate to your Excel workbook where your chart is embedded. Click on any part of the chart to highlight it. This action will indicate that you’ve selected the chart, typically shown by the appearance of handles around its border.

- Place your cursor over the border of the chart until you see the four-way arrow pointer.
- Left-click and the chart will be selected.
Step 2: Open the Chart Tools Menu

With your chart selected, the ‘Chart Tools’ menu will become active in the ribbon at the top of Excel. This menu provides tools specific to chart manipulation.
- Go to the ‘Design’ or ‘Layout’ tab under ‘Chart Tools.’
- Explore the options related to chart editing and placement.
Step 3: Move Chart Location

Now, it’s time to instruct Excel to place the chart in a new sheet:
- Click on the ‘Move Chart’ icon in the ‘Location’ group of the ‘Design’ tab. Alternatively, you can right-click on the chart and select ‘Move Chart’ from the context menu.
- The ‘Move Chart’ dialog box will pop up.
- Select ‘New sheet’ and optionally name the new sheet or leave it with the default name, ‘Chart1.’
- Press ‘OK.’
Step 4: Verify Chart Movement

After executing the command, Excel will create a new sheet for your chart:
- Look for the newly created sheet in the workbook tab list.
- Confirm that your chart is now in the newly created sheet.
Step 5: Customize and Finalize

With the chart in its new home, you can now customize it to suit your needs:
- Adjust the chart’s layout, style, or data range directly from the chart tools.
- Ensure that the chart title reflects the data series or purpose of the graph.
- Check if the legend is correctly positioned and contains all necessary information.
💡 Note: Always verify that the chart’s source data remains linked to the original data range to avoid any data mismatch.
In wrapping up this guide, the process of moving an Excel graph to a new sheet is quite straightforward, yet it's a task that can streamline your workbook management. This method not only keeps your data organized but also provides a clear visual representation that can be easily shared or presented to others. As you've learned, selecting the chart, accessing the chart tools, moving the chart, verifying its placement, and making final adjustments are key to perfecting your spreadsheet workflow. By following these steps, you can ensure that your Excel charts are as effective and as organized as possible, enhancing your data analysis experience.
Can I move multiple charts at once to a new sheet?

+
Unfortunately, Excel does not support moving multiple charts to a new sheet simultaneously. You need to move each chart one at a time using the steps outlined in this guide.
What if I want to link the chart to specific data range?

+
You can adjust the data range of the chart before moving it. When the chart is in its new sheet, right-click on the chart, select ‘Select Data’, and modify the data source accordingly.
Can I delete the source data after moving the chart?

+
Deleting the source data will disconnect the chart from its data, resulting in the chart displaying errors. Keep your source data intact or use structured references in named ranges for more flexible chart updates.