5 Ways to Move Chart to Own Sheet in Excel

Charts are a pivotal tool in Microsoft Excel for analyzing and presenting data visually, enabling users to better understand trends, patterns, and anomalies within datasets. In Excel, charts can either clutter up your worksheets or be beautifully organized by moving them to their own dedicated sheets. Here’s how you can enhance your workbook’s efficiency by moving a chart to its own sheet in Microsoft Excel.
Understanding Chart Sheets

A Chart Sheet in Excel is a separate, dedicated space within your workbook designed solely for displaying a chart without the distractions of other data or cell content. Moving a chart to its own sheet not only declutters your data workspace but also provides more room for adding chart elements like titles, labels, or legends.
5 Ways to Move Chart to Own Sheet in Excel

Method 1: Using the Ribbon

- Select the chart you want to move.
- Navigate to the Chart Tools section that appears.
- Go to the Design tab, and under the Location group, click on Move Chart.
- In the Move Chart dialog box, choose New Sheet and optionally name it.
- Hit OK, and Excel will transfer the chart to the new sheet.
Method 2: Using the Context Menu

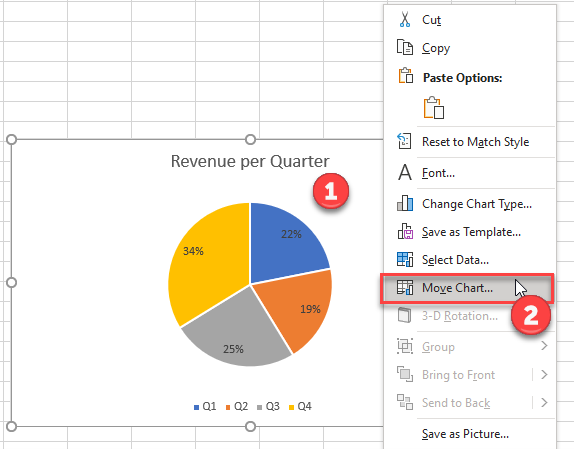
- Right-click on the chart in question.
- From the context menu, select Move Chart….
- Similarly, choose New Sheet and proceed.
💡 Note: If your chart already exists, context menu offers an easier alternative, especially when navigating with a mouse or touchpad.
Method 3: Shortcut Keys

- Select your chart.
- Press Alt + F1 which creates a new chart sheet instantly.
💡 Note: This method creates a new chart rather than moving an existing one, useful when you're starting fresh.
Method 4: Via Object Pane

- Open the Selection Pane from the Home tab’s Editing group.
- Select your chart.
- From the pane, right-click the chart’s entry.
- Choose Move Chart and follow the usual steps.
Method 5: Using VBA

For those familiar with VBA, automate the process:
Sub MoveChartToNewSheet() Dim cht As ChartObject Dim ws As Worksheet Dim newSheet As ChartSet cht = ActiveSheet.ChartObjects(1) Set newSheet = ActiveWorkbook.Charts.Add cht.Chart.Copy newSheet.Name = "My Chart" newSheet.Paste cht.Delete
End Sub
💡 Note: VBA requires a bit more technical know-how but automates repetitive tasks effectively.
Best Practices for Chart Management in Excel

- Naming Charts: Always name your charts for easy reference and management.
- Organize Charts: Consider grouping related charts or moving them to separate sheets to keep your workbook organized.
- Accessing Charts: Use hyperlinks or bookmarks in the workbook to navigate to chart sheets quickly.
- Data Source Changes: If you move a chart to its own sheet, remember to update the data source link if necessary.
Wrapping up, moving charts to their own sheets in Excel not only organizes your data but also provides a cleaner workspace for analysis and presentation. Whether you opt for the simplicity of using the Ribbon, the convenience of context menus, keyboard shortcuts, the Selection Pane, or the automation of VBA, Excel offers multiple avenues to tailor your workflow to your preferences.
What are the advantages of moving charts to separate sheets?

+
Moving charts to separate sheets helps declutter your worksheets, enhances readability, allows for larger and more detailed charts, and can streamline your workbook’s organization.
Can I undo moving a chart to its own sheet?

+
Yes, if you move a chart to a separate sheet and then want to revert, simply right-click the chart, select Move Chart…, choose the original location, and hit OK.
How do I update the data source of a chart on a separate sheet?

+
To update the data source, double-click the chart to open the Chart Tools. Go to the Data tab, click on Select Data, and choose or modify your data range accordingly.