Mapping Excel Sheets: Mastering XY Data Plotting Guide
Plotting XY data on an Excel chart can transform raw data into visual stories, revealing trends, patterns, and insights that might otherwise go unnoticed. This comprehensive guide is designed to teach you the ins and outs of plotting XY data in Excel, ensuring you can present your data effectively. Whether you're a business analyst looking to forecast sales trends, a scientist plotting experimental results, or a student working on a project, mastering this skill will enhance your ability to communicate complex information clearly.
Understanding XY Scatter Plots


XY scatter plots are essential for visualizing relationships between two numeric variables. Here’s why they are crucial:
- They help identify correlations or patterns in your data.
- They are useful for comparing multiple datasets.
- They can highlight data outliers, which might be of interest in your analysis.
Preparing Your Data
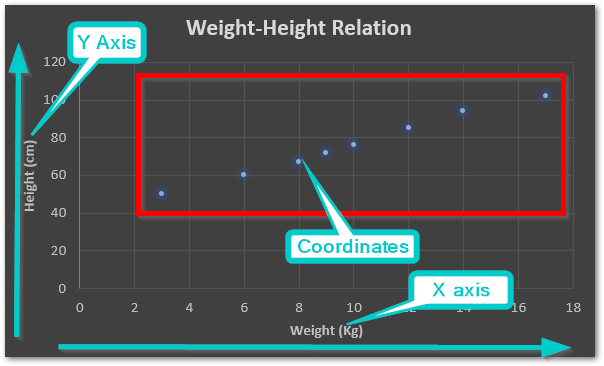
Before you begin plotting, ensure your data is organized properly:
- Each variable should be in a separate column.
- The first column might represent your independent variable (X-axis), and the next column would be your dependent variable (Y-axis).
- Clean your data by removing any empty or erroneous entries.
Plotting the Data

Here’s how to create an XY scatter plot in Excel:
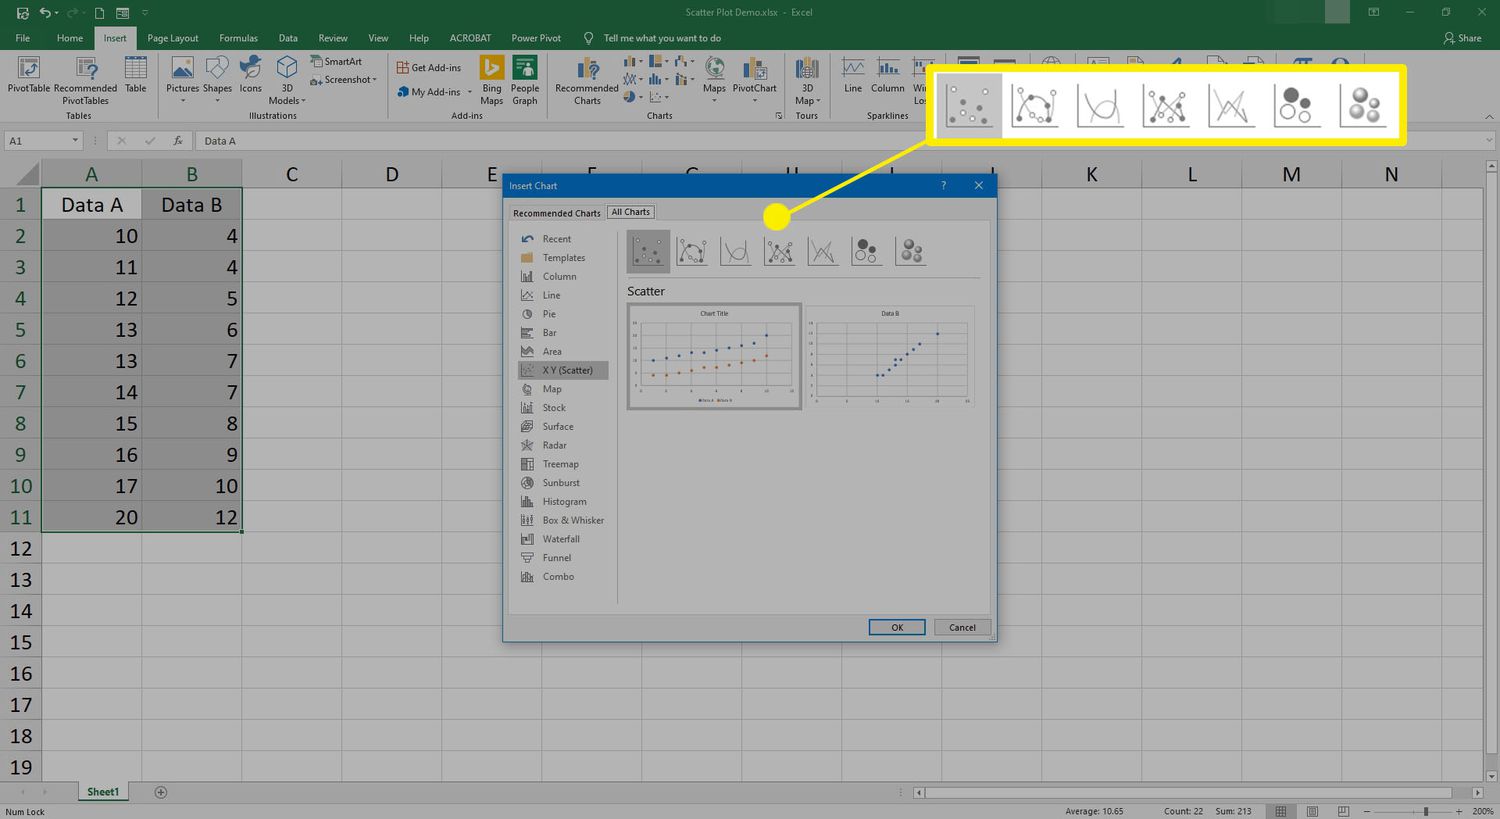
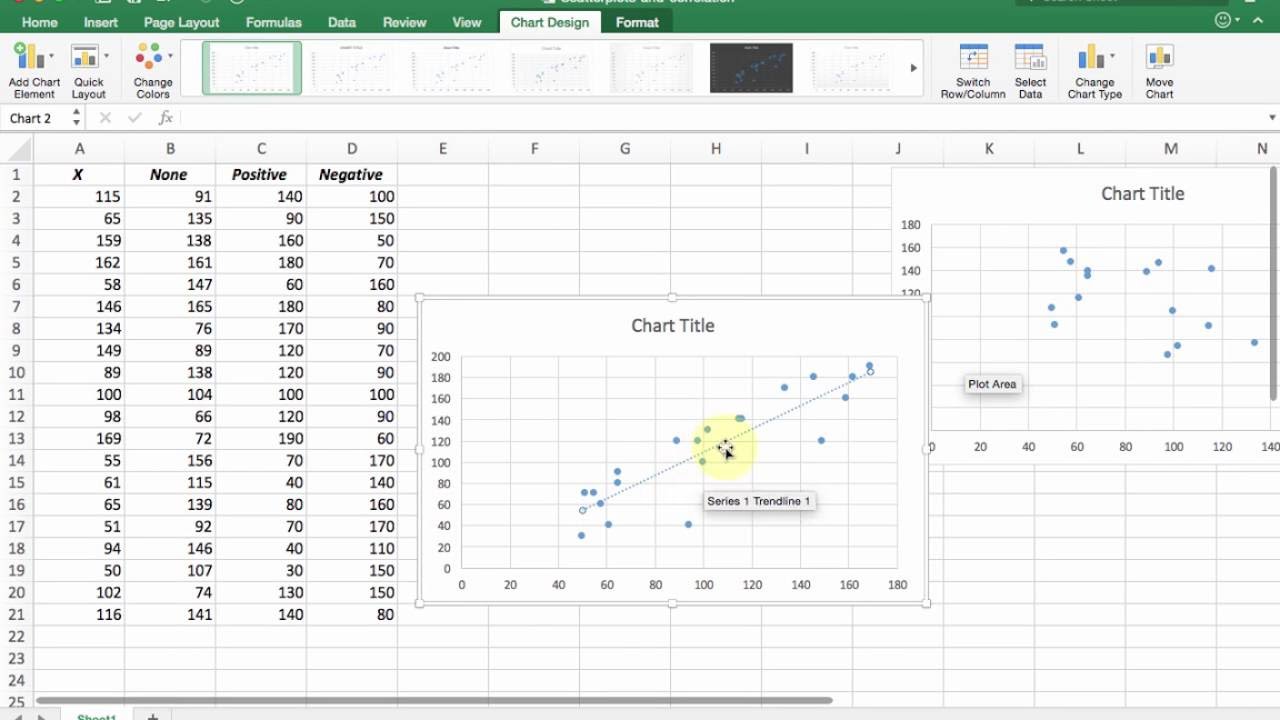
- Select your data range, including headers.
- Go to the ‘Insert’ tab on the ribbon.
- Click on ‘Scatter’ under the ‘Charts’ section, then choose ‘Scatter with only Markers’ or any other style that suits your needs.
- Excel will automatically plot your data, with the columns you selected for X and Y.
Customizing Your Scatter Plot
Once your plot is created, customization is key for better presentation:
- Chart Title: Add a descriptive title to convey the main idea of the plot.
- Labels: Label axes to clarify what each axis represents.
- Legends: Include a legend if plotting multiple data sets.
- Color and Marker: Use different colors or marker types for different data series.
- Axis Scales: Adjust the scale of your axes to focus on the relevant data range.
- Gridlines: Optionally, add gridlines for easier data interpretation.
Adding Trendlines
Trendlines can help in analyzing the data trend:
- Right-click on any data point and select ‘Add Trendline’.
- Choose the type of trendline (linear, exponential, etc.) that fits your data best.
- Adjust the formatting as needed.
Error Bars
To show data variability or uncertainty:
- Click on the chart to activate the ‘Chart Tools’.
- Under ‘Chart Layout’, click on ‘Error Bars’, then ‘More Error Bars Options’.
- Configure the error bar settings to represent standard deviation, standard error, or custom values.
Advanced Techniques
For more advanced analysis:
- Data Labels: Add labels to show exact values for key points.
- Formatting: Use ‘Format Data Series’ to adjust line style, marker size, or color to highlight specific areas or trends.
- 3D Plots: Excel allows for 3D scatter plots, but they can be less clear than 2D representations.
By following these steps, you'll be equipped to turn your data into an informative and visually appealing chart. Remember, the goal is to make your data speak to your audience, telling a story that leads to insights or action.
📝 Note: Always ensure your data is clean and well-formatted before plotting. Any discrepancies or errors in the data can mislead the analysis or the resulting visual representation.
Plotting XY data in Excel is more than just creating a chart; it's about storytelling with data. By mastering these techniques, you can convey complex information with clarity, making your reports or presentations more effective and your analyses more profound. Keep practicing, exploring, and customizing your charts to unlock the full potential of Excel for data visualization.
What is the difference between XY scatter plots and line charts?
+
XY scatter plots show the relationship between two numeric variables. Each dot represents one data point, showing how one variable changes with respect to another. Line charts, on the other hand, are typically used to track changes over continuous data like time, where the X-axis is always a sequence of values (e.g., dates, times).
How do I ensure my data is plotted correctly?

+
Ensure your data is well-organized with variables in separate columns. Select the data range carefully when inserting the chart, and check the axis labels to confirm the correct representation of variables on each axis.
Can I plot multiple series of data on one scatter plot?
+
Yes, Excel allows you to plot multiple data series on a single scatter plot. Simply select all series when creating the chart or add more series by selecting ‘Select Data’ from the chart tools and adding new series manually.