5 Simple Steps to Add Marks on Excel Charts Manually

Excel charts are powerful tools that help in visually representing data. While Excel offers automated chart creation, sometimes the need arises to manually add marks or annotations to clarify or highlight specific data points. Here's a guide on how you can enhance your Excel charts by adding marks manually in five simple steps:
Step 1: Prepare Your Chart

- Open your Excel workbook where your data is stored.
- Select the range of data you wish to chart.
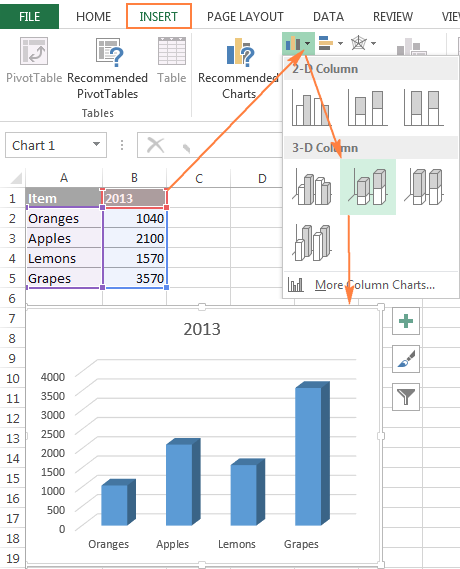
- Insert a chart by clicking on the “Insert” tab and choosing the chart type that best suits your data.
- Adjust the chart’s elements like titles, axes labels, and legend for better readability.
Step 2: Add Data Points

If your chart already has data points, you can skip to Step 3. If not, here’s how to add them:
- Right-click on the chart and choose “Select Data”.
- Add a new series by clicking on “Add”.
- Name your new series and provide the range for the X and Y values that you want to highlight.
Step 3: Format Data Points

- With the chart selected, click on any series or point to select it.
- Right-click and choose “Format Data Series” or “Format Data Point”.
- In the formatting pane, you can change the marker options such as shape, size, color, and border for each point.
- To highlight specific points, you can adjust these settings individually or format all data points at once for uniformity.
📌 Note: Ensure you save your formatting for future reference by selecting “Save As Template” from the chart menu.
Step 4: Add Annotations

To further explain or highlight specific data points, follow these steps:
- Click on the chart to select it.
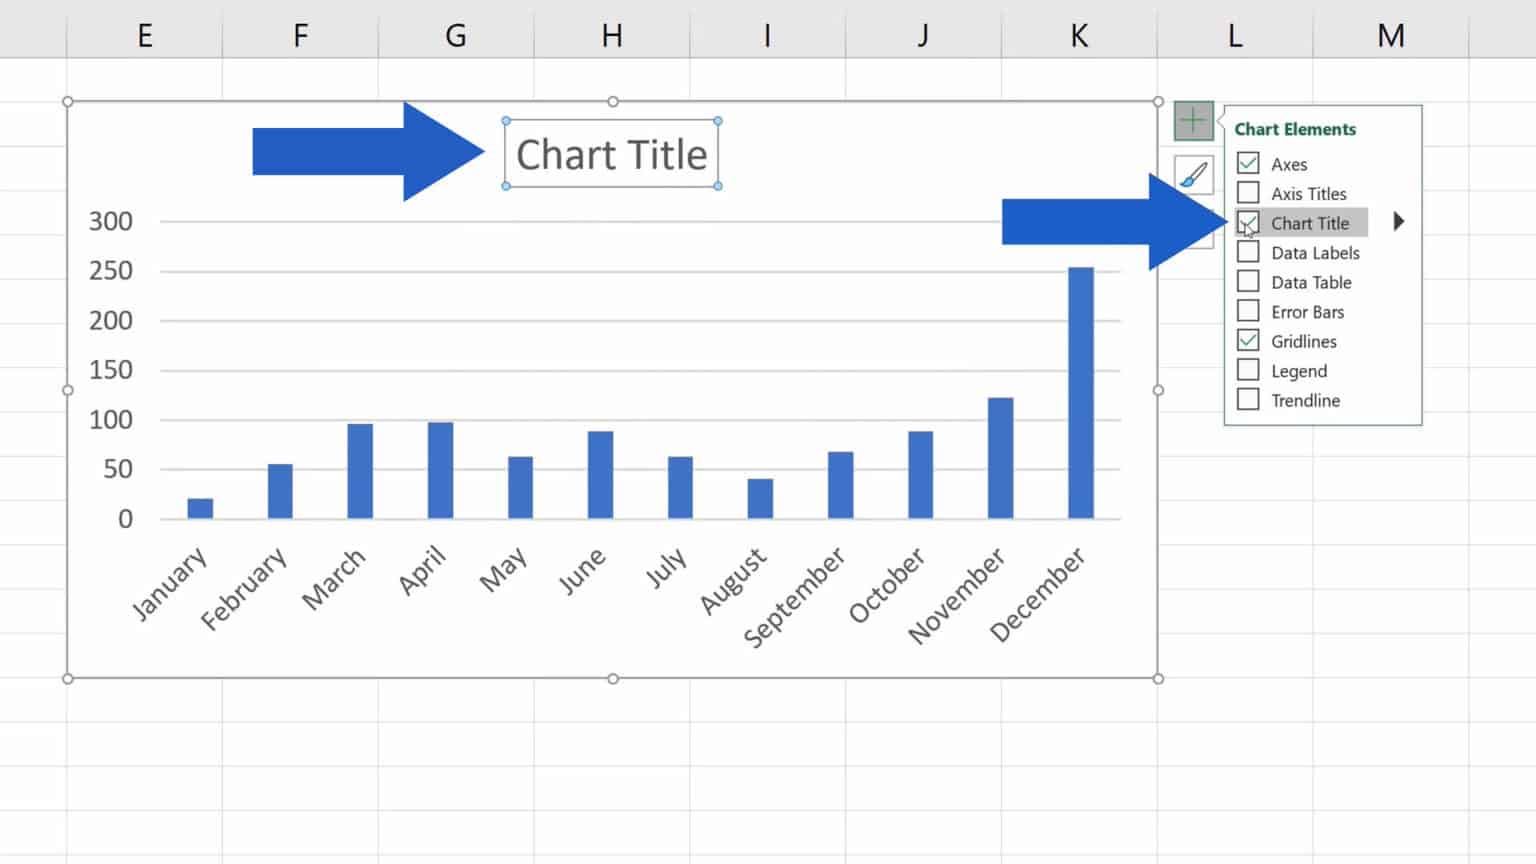
- From the “Chart Tools” menu, click on “Layout” or “Add Chart Element” depending on your Excel version.
- Select “Text Box” to add a box where you can type your annotation or “Data Labels” to label specific data points.
- Adjust the position of your annotation to ensure it does not obstruct the chart’s readability.
- You can format the text, font size, color, or add callouts using the formatting tools.
Step 5: Review and Refine

After adding the marks and annotations:
- Review the chart to ensure all marks are visible and appropriately placed.
- Check for any overlapping text or marks and refine their positions or formatting if necessary.
- Save your work. You might also consider exporting the chart as an image or a PDF for presentations or reports.
📌 Note: Always remember to keep your chart clutter-free; less is often more when it comes to chart annotations.
In summary, manually adding marks on Excel charts not only clarifies data but also engages the viewer by providing visual cues to important insights. By following these five steps, you can create charts that are not only informative but also visually appealing, aiding in better data storytelling.
Can I add custom shapes as marks on my Excel chart?

+
Yes, you can insert custom shapes or icons from the “Insert” tab and position them manually on your chart for added visual appeal.
What if I want to highlight a trend instead of individual points?

+
Use trendlines. Right-click on the data series, select “Add Trendline”, and choose the type of trendline you wish to highlight, like linear or moving average.
How do I make my chart less cluttered?

+
Keep annotations minimal and use formatting like larger markers or a different color to highlight key points without overwhelming the viewer.
Can I automate the process of adding marks on Excel charts?

+
Excel VBA scripting can help automate marking specific data points based on predefined conditions or calculations.