Mastering Balance Sheet Management in Excel Easily

In the world of finance, the balance sheet is a cornerstone document that provides a snapshot of a company's financial health at any given time. Understanding how to manage and analyze a balance sheet in Excel can give business owners, accountants, and financial analysts a significant edge. This comprehensive guide will walk you through mastering balance sheet management in Excel, making complex financial analysis accessible and straightforward.
Understanding the Components of a Balance Sheet


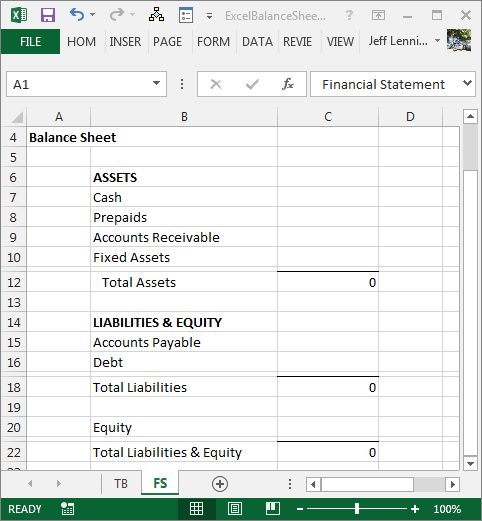
The balance sheet essentially comprises three key sections:
- Assets: Everything the company owns that has value, such as cash, inventory, accounts receivable, and long-term investments.
- Liabilities: The obligations and debts the company owes, like loans, accounts payable, and deferred revenues.
- Equity: Represents the residual interest in the assets of the company after deducting liabilities, often called shareholder’s equity or owner’s equity.
Setting Up Your Excel Workbook

Before you can manage a balance sheet effectively in Excel, you need to set up your workbook correctly:
- Create separate sheets: Allocate one sheet for assets, one for liabilities, and another for equity.
- Use named ranges: Naming your ranges can simplify referencing data across different sheets.
- Set up a master balance sheet: This should consolidate data from the separate sheets for an overview.
Entering Data into Excel

Accurately entering data is vital for balance sheet management:
- Include headers for each column in your balance sheet, such as “Description,” “As of Date,” “Current Amount,” etc.
- Ensure each line item corresponds to an account or financial concept relevant to your business.
- Implement date-sensitive entries to reflect historical and current financial data.
Formulas and Functions for Automation

Excel’s power lies in its ability to automate calculations:
- SUM: For adding up totals in columns or rows.
- VLOOKUP or INDEX-MATCH: To pull data from different sheets or sources.
- SUBTOTAL: To calculate subtotals for different categories.
- PMT: For calculating loan payments.
Creating Pivot Tables for Deep Analysis

Pivot Tables in Excel can help you analyze balance sheet data in various ways:
- Summarize assets, liabilities, or equity by different dimensions (e.g., by category, time period).
- Track changes over time to identify trends or anomalies.
- Compare financial data across different periods or scenarios.
Visualizing Data with Charts


Charts can make complex data digestible:
- Line Charts for showing trends over time.
- Column/Bar Charts to compare different segments of your balance sheet.
- Pie Charts for understanding the composition of assets, liabilities, or equity.
Data Validation and Conditional Formatting

Ensure data accuracy and enhance visual appeal:
- Set up data validation rules to prevent incorrect entries.
- Apply conditional formatting to highlight key figures, such as negative balances or significant changes.
Building Macros for Efficiency

Use VBA (Visual Basic for Applications) to automate repetitive tasks:
- Create macros to automate balance sheet updates or report generation.
- Set up user forms to enter data systematically.
- Develop custom functions tailored to your balance sheet needs.
💡 Note: Always backup your Excel workbook before running macros or performing complex manipulations.
Advanced Balance Sheet Analysis Techniques

To go beyond the basics:
- Common Size Analysis: Express line items as a percentage of total assets or liabilities.
- Liquidity Ratios: Analyze current and quick ratios to assess short-term financial stability.
- Solvency Ratios: Use debt-to-equity or times interest earned to gauge long-term solvency.
- Profitability Analysis: Compare equity to assets to see how effectively assets generate profit.
Mastering Balance Sheet Ratios

| Ratio Name | Formula | Indicates |
|---|---|---|
| Current Ratio | Current Assets / Current Liabilities | Short-term liquidity |
| Debt to Equity Ratio | Total Liabilities / Total Shareholder Equity | Financial leverage |
| Return on Equity (ROE) | Net Income / Shareholder’s Equity | Profitability to equity holders |

🌟 Note: Understanding these ratios provides insights into different aspects of a company's financial health, but always consider industry benchmarks for context.
Dealing with Complex Financial Structures
Many companies have intricate financial structures:
- Consolidate multiple balance sheets for subsidiary companies.
- Account for foreign currency translation effects.
- Analyze off-balance sheet items like leases or contingent liabilities.
To manage your balance sheet effectively, you've learned how to:
- Set up Excel for balance sheet management with appropriate sheets and named ranges.
- Automate data entry and calculations using Excel's powerful functions and formulas.
- Use advanced techniques like pivot tables, charts, and macros to analyze and present data effectively.
- Explore ratios and financial analysis techniques to understand the health of the business better.
By mastering these skills in Excel, you equip yourself with the tools necessary for robust financial decision-making, compliance, and strategic planning. Understanding your balance sheet, and making informed decisions based on this data, can lead to improved financial performance and strategic advantage in any market condition.
What are the key components of a balance sheet?

+
The three key components are Assets, Liabilities, and Shareholder’s Equity.
How can Excel automate balance sheet management?

+
Excel automates balance sheet management through formulas, functions, pivot tables, and macros, reducing manual data entry and calculation errors.
Why is ratio analysis important?

+
Ratio analysis is crucial for interpreting the financial health, performance, and potential issues within a business through standardized metrics.