Mastering Excel Worksheets: Quick & Easy Guide

Excel worksheets are powerful tools for data organization, analysis, and visualization, used widely in both personal and professional settings. Whether you're tracking expenses, managing a large dataset, or preparing for a business presentation, Excel's versatility makes it an essential software for productivity. This guide is designed to help you master Excel worksheets quickly and efficiently, allowing you to enhance your workflow and make data handling a breeze.
Setting Up Your Excel Workbook

Before diving into the functionalities of Excel, it's crucial to set up your workbook correctly:
- Open Excel: Launch Excel on your computer or access it online via Office 365.
- Create a New Workbook: If you're starting from scratch, select "Blank workbook".
- Save Your Workbook: It's good practice to save your work frequently. Click File > Save As, choose a location, and name your file.

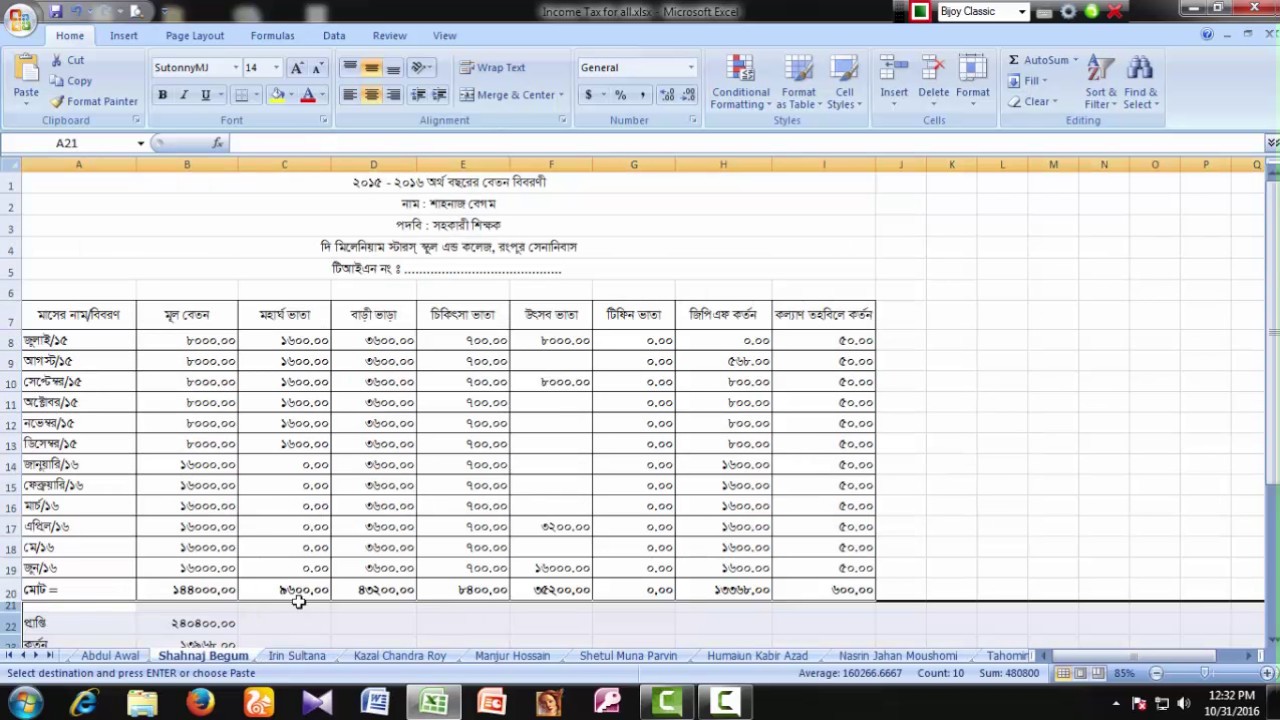
Navigating the Excel Interface

Understanding Excel's user interface is fundamental to mastering its functionalities:
- Ribbon: Contains most of Excel's commands, organized into tabs like Home, Insert, and Data.
- Formula Bar: Shows the contents of the active cell and where formulas are entered or edited.
- Cell: The basic unit of a spreadsheet, where data is entered.
- Worksheet Tabs: Navigate between different sheets within a workbook.
- Name Box: Displays the current cell's address or named range.
📝 Note: Familiarize yourself with these elements as they are key to Excel's functionality.
Data Entry and Management

Data entry in Excel can be straightforward if you know these tips:
- Direct Entry: Click on a cell and start typing your data.
- AutoFill: Use Excel's AutoFill feature to quickly fill cells with data patterns or sequences by dragging the fill handle.
- Data Validation: Set rules for what data can be entered into a cell using Data > Data Validation to ensure accuracy.
Formulas and Functions

Excel’s strength lies in its ability to perform complex calculations with ease:
| Function | Description |
|---|---|
| =SUM() | Adds up all numbers in a range of cells |
| =AVERAGE() | Calculates the average of a selected range |
| =IF() | Checks a condition, returns one value if true and another if false |
| =VLOOKUP() | Looks for a value in the leftmost column of a table and returns a value in the same row from another column |

Understanding how to use these functions will save you time and increase the accuracy of your data analysis:
Formatting for Clarity and Impact

To make your data more readable and visually appealing:
- Conditional Formatting: Highlights cells based on specific criteria, making trends or outliers stand out.
- Number Formatting: Adjust how numbers, dates, or times are displayed with Home > Number.
- Cell Styles: Predefined styles help maintain a consistent look across your workbook.
Visualizing Data with Charts and Graphs

Excel's charting capabilities turn data into insights:
- Insert a Chart: Select your data and click Insert > Chart to choose from various types like Column, Line, Pie, or Bar.
- Customize Charts: Use the Chart Tools that appear once a chart is selected to modify chart elements, style, and data series.
- Dynamic Charts: Charts that update as data changes.

In conclusion, mastering Excel worksheets involves understanding its interface, learning how to efficiently enter and manage data, leveraging formulas and functions for calculations, formatting data for readability, and visualizing it with charts. By following these steps, you'll not only increase your productivity but also gain a deeper understanding of your data, leading to better decision-making and presentation capabilities. Remember, practice is key; the more you work with Excel, the more intuitive and powerful it becomes.
How do I autofit column width in Excel?

+
To autofit column width in Excel, select the column or columns you want to adjust, then double-click the right border of the column header. The columns will automatically adjust to fit the content width.
Can I use macros in Excel?

+
Yes, you can use macros in Excel to automate repetitive tasks. Go to Developer > Record Macro to start recording actions, or write your own macro in VBA (Visual Basic for Applications).
What’s the easiest way to filter data in Excel?

+
The simplest way to filter data is to select the range or table of data you want to filter, then click Data > Filter. This adds drop-down arrows to your column headers, allowing you to filter data based on values or criteria.