Excel Sheet Creation Guide: Easy Step-by-Step Process

In the digital age, the ability to manage data effectively is crucial, whether you’re a student, a professional, or someone who loves organizing personal activities. Microsoft Excel stands out as a versatile tool for data analysis, storage, and presentation. Here’s how you can create and manage an Excel sheet with ease, following a step-by-step process.
Preparing to Create an Excel Sheet
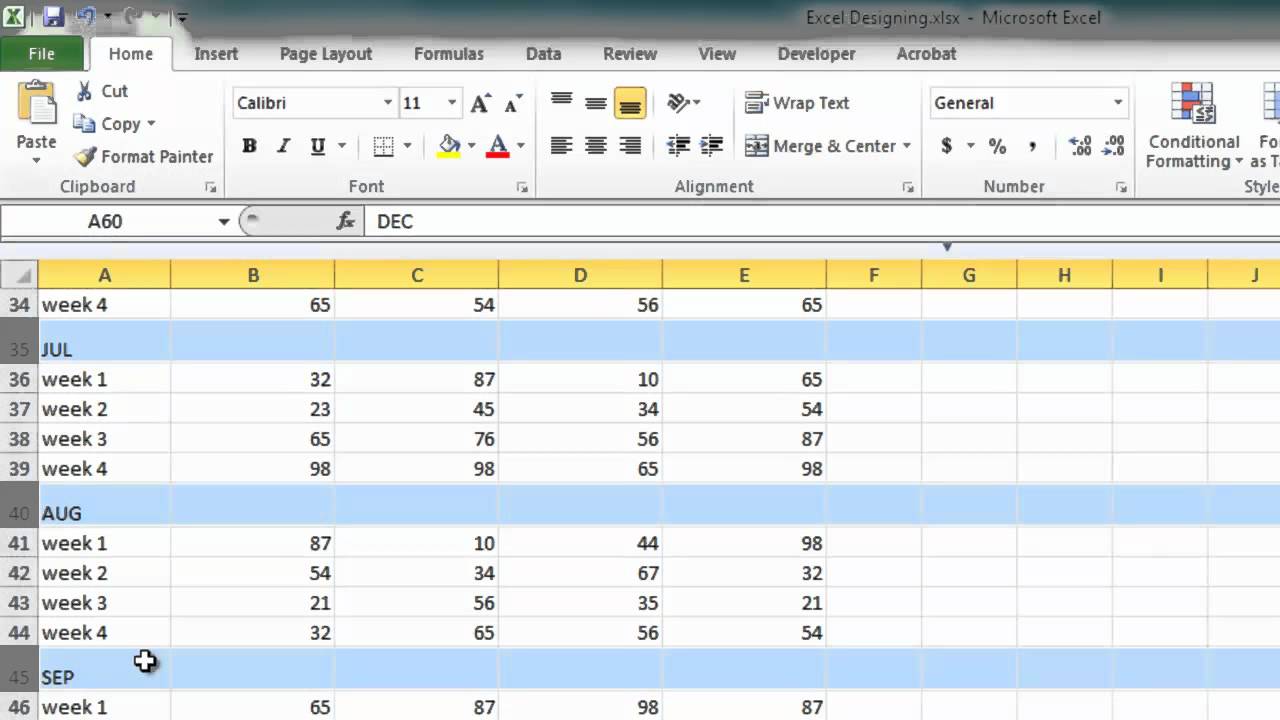
Before diving into Excel, setting up your workspace and understanding basic Excel terminology can make the experience smoother:
- Familiarize Yourself: Understand the basics like columns, rows, cells, ranges, and formulas.
- Software Setup: Ensure you have Excel or a comparable alternative installed. Google Sheets is a free option available online.
- Identify Your Data: Know what data you want to input. This could be student grades, sales figures, event planning, etc.
Step-by-Step Guide to Creating an Excel Sheet

Step 1: Open Excel

Open your Microsoft Excel application. If you’re using Google Sheets or a different spreadsheet program, start it up.
Step 2: Name Your Workbook

Upon opening Excel, you’ll see a blank workbook. Click ‘File’ > ‘Save As’, choose a location, and give your workbook a relevant name:
<p class="pro-note">💡 Note: It's always good to save your work regularly to avoid losing data.</p>
Step 3: Organizing Your Data

- Create Headers: In row 1 or A1 to F1, type the titles for your columns, e.g., ‘Name’, ‘Item’, ‘Price’, ‘Quantity’, ‘Date’, ‘Total’.
- Enter Data: Begin inputting your data in the rows beneath the headers.
Step 4: Formatting Your Sheet
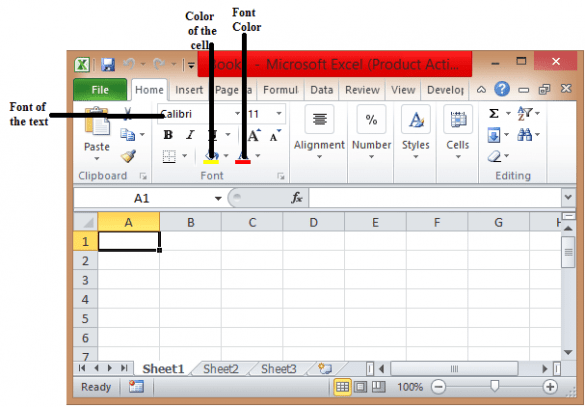
- Adjust Column Widths: Double-click or drag the column dividers to resize them.
- Apply Cell Styles: Use bold for headers, and you might want to use different colors to differentiate between headers and data.
- Number Formatting: Format numbers for currency, date, or other specific types.
Step 5: Adding Formulas
Excel’s strength lies in its formula capabilities:
- Total Calculation: To calculate the total for an item (Price * Quantity), in the ‘Total’ column, use the formula
=B2*C2, assuming B2 contains the price and C2 the quantity. - Sum: Use
=SUM(D2:D6)to add up the ‘Quantity’ column from row 2 to 6.
Step 6: Creating Charts
Charts can visually represent your data:
- Select your data, go to ‘Insert’, and choose the chart type (e.g., Column Chart, Line Graph, Pie Chart).
- Customize the chart by adjusting colors, labels, and adding titles.
Step 7: Data Validation and Error Checking

- Input Validation: Use ‘Data Validation’ to ensure data is entered correctly (e.g., only accepting dates or numbers within a certain range).
- Error Checking: Use Excel’s built-in functions to highlight or correct errors.
Step 8: Protecting Your Sheet

To prevent accidental changes:
- Protect Sheet: Go to ‘Review’ > ‘Protect Sheet’, set a password if needed.
Step 9: Saving and Sharing

- Save: Save your changes with ‘Ctrl + S’ or ‘File’ > ‘Save’.
- Sharing: You can share your workbook via email, or if using Google Sheets, share directly.
<p class="pro-note">✍️ Note: When sharing, you can set different levels of access, like viewing, commenting, or editing.</p>
With these steps, you’ve now created a basic yet functional Excel sheet. Excel is not just a data entry tool; it’s a powerful platform for data analysis and visualization.
To wrap up, mastering Excel enhances your ability to organize and analyze data, whether for academic, personal, or professional purposes. Remember, practice makes perfect, so continue exploring Excel’s features and functions.
How often should I save my Excel document?
+
Save your work frequently, especially when working with large datasets or complex calculations. Enable AutoRecover in Excel to recover unsaved work if needed.
Can I link data between different Excel sheets?
+Yes, you can use cell references to link data across sheets in the same workbook. For example, ‘=Sheet2!A1’ would reference cell A1 from Sheet2.
What if I want to automate repetitive tasks in Excel?
+Utilize macros. Excel’s Visual Basic for Applications (VBA) allows you to record and execute sequences of tasks automatically.
How do I ensure data security in Excel?
+Use the ‘Protect Sheet’ and ‘Protect Workbook’ features to prevent unauthorized changes. Additionally, consider encrypting the file with a password for extra security.
Can I create interactive reports in Excel?
+Yes, by using Pivot Tables, slicers, and dashboard tools, you can make your reports interactive, allowing users to filter and view data dynamically.