Excel Stock Market Tracking: A Beginner's Guide

In today's fast-paced financial environment, keeping an eye on your investment portfolio can be both exhilarating and overwhelming. Whether you're a seasoned investor or just dipping your toes into the stock market, Excel remains one of the most accessible tools for tracking your financial assets. This guide will provide you with a step-by-step approach to using Excel for stock market tracking, making it simpler for beginners to manage their investments effectively.
Why Use Excel for Stock Market Tracking?
Excel offers several advantages for stock market tracking:
- Accessibility: Nearly everyone has access to Microsoft Excel or Google Sheets, which supports similar functions.
- Customization: You can tailor your spreadsheets to track the metrics that matter most to you.
- Data Analysis: With Excel's formulas and functions, analyzing stock performance is straightforward.
Setting Up Your Spreadsheet

Here's how to get started with setting up your tracking system:
1. Basic Setup

Begin by opening a new Excel workbook:
- Name your workbook something intuitive like “Stock_Tracker” or “Investment_Portfolio_2023”.
- Create columns for essential data:
| Column A: | Date |
| Column B: | Stock Name |
| Column C: | Symbol |
| Column D: | Purchase Price |
| Column E: | Current Price |
| Column F: | Change |
| Column G: | Percentage Change |
| Column H: | Quantity |
| Column I: | Total Cost |
| Column J: | Current Value |
| Column K: | Profit/Loss |

2. Importing Stock Data

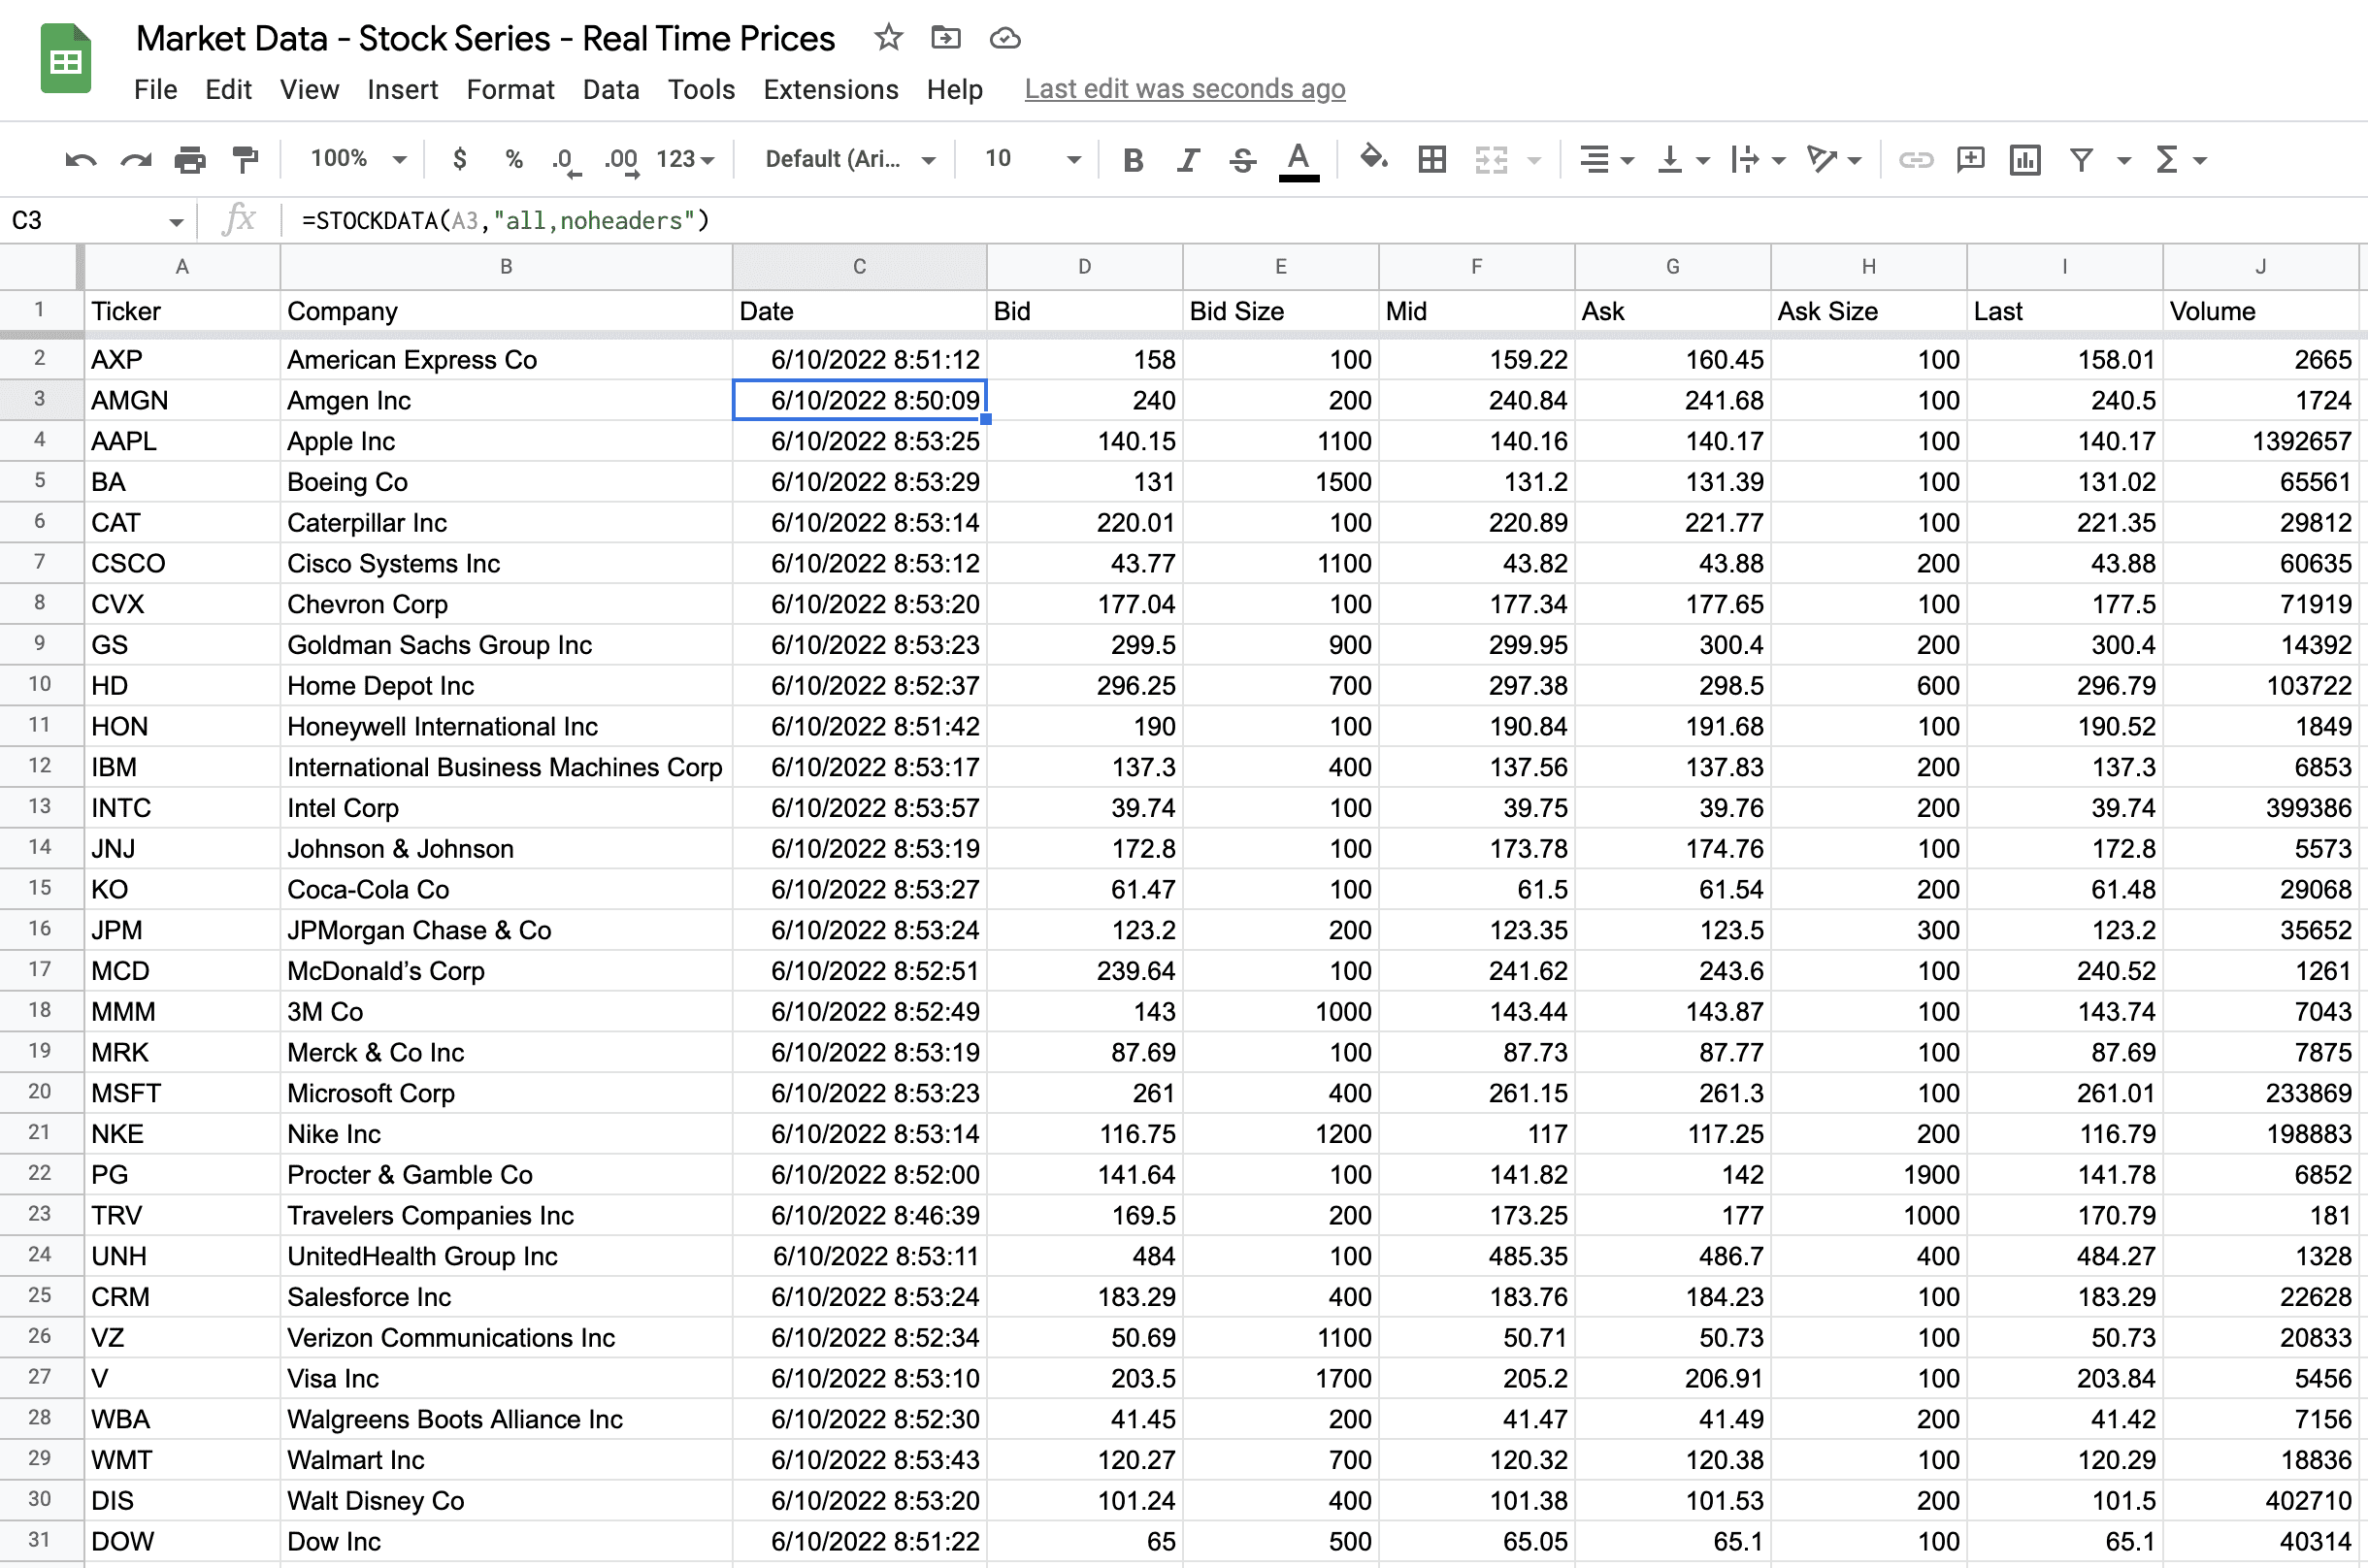
To automate data retrieval, you can use Excel’s ability to import data from financial websites or API services:
- Yahoo Finance or Google Finance: Free sources for real-time or delayed stock quotes.
- Web Queries: You can set up Excel to automatically fetch stock prices with Web Queries, although this requires some setup.
💡 Note: Most free APIs limit the number of calls you can make. Be mindful of these limits to avoid service interruptions.
3. Entering Formulas
Here’s how you can set up key formulas:
- Change:
=E2-D2in cell F2. - Percentage Change:
=F2/D2in cell G2. - Total Cost:
=D2*H2in cell I2. - Current Value:
=E2*H2in cell J2. - Profit/Loss:
=J2-I2in cell K2.
Drag the formulas down to apply them to all rows where you enter data.
4. Formatting for Clarity

Ensure your data is easy to read:
- Format cells to display currency or percentages where appropriate.
- Use conditional formatting to highlight positive and negative changes in stock prices.
- Freeze the top row to keep your headers in view as you scroll.
5. Advanced Features
Once comfortable with the basics, explore advanced tracking options:
- Stock Charts: Use Excel’s charting tools to visualize stock performance.
- Data Validation: Set rules to ensure data entry accuracy.
- Pivot Tables: For summarizing portfolio performance over time or by stock.
Common Pitfalls and How to Avoid Them
Here are some common issues and solutions:
- Manual Data Entry Errors: Utilize Excel's data validation or import data directly to reduce mistakes.
- Formula Errors: Use Excel's Formula Auditing tools to track errors back to their source.
- Data Lag: If using free data sources, understand the potential delay in updates.
Maximizing Your Excel Stock Tracker

To get the most out of your Excel stock tracker:
- Set up weekly or monthly performance reviews using pivot tables or charts.
- Integrate with other financial tools or applications for a holistic view of your investments.
- Keep your spreadsheet updated with new stocks or changes in your portfolio.
🔔 Note: Regularly backing up your Excel file ensures your data is safe against potential file corruption or system failures.
Using Excel for tracking stock market activities not only simplifies the monitoring process but also allows for in-depth analysis and customization. By following these steps, you can create a powerful tool for managing your investments, making informed decisions, and potentially maximizing returns. Remember that while Excel provides the means for tracking, your investment choices and strategies remain your responsibility. Continuous learning, staying updated with market trends, and consulting with financial advisors can complement your tracking efforts for better outcomes.
Can I automate the data entry process in Excel?

+
Yes, you can automate data entry by setting up Web Queries or using Excel’s Power Query functionality to pull data directly from financial websites or APIs. However, be aware of API limitations and potential delays in free data services.
Is Excel a reliable tool for real-time stock tracking?
+
Excel can provide real-time stock data through third-party services or APIs, but free sources often have a delay in their data feeds. For truly real-time tracking, professional stock tracking software or paid APIs might be more reliable.
How can I make my stock tracker more visually appealing?

+
Use conditional formatting to color-code stock performance, create charts to visualize trends, and apply Excel’s themes and styles to enhance overall aesthetics.