5 Steps to Craft the Perfect Excel Data Sheet

In the modern business landscape, the ability to organize and analyze data effectively is essential for making informed decisions. Excel, with its robust features, stands as a pivotal tool in this realm, enabling users to transform raw data into insightful reports. Whether you're tracking sales, managing inventory, or analyzing survey results, having a well-structured data sheet can significantly boost your productivity. This guide outlines five critical steps to craft the perfect Excel data sheet, ensuring your data not only looks professional but also maximizes efficiency in analysis.
Step 1: Plan Your Data Structure

Before you start entering data into Excel, it’s crucial to plan your data structure:
- Identify Data Categories: Determine what types of data you will be working with. Are you tracking numerical data, dates, text, or a combination?
- Define Relationships: Understand how different data points relate to one another. This can include parent-child relationships or dependencies.
- Create a Rough Sketch: Sketch out your data structure on paper or a digital notepad. This helps in visualizing the layout before implementation.

Step 2: Set Up Your Spreadsheet

Once you have a plan, it’s time to create your Excel data sheet:
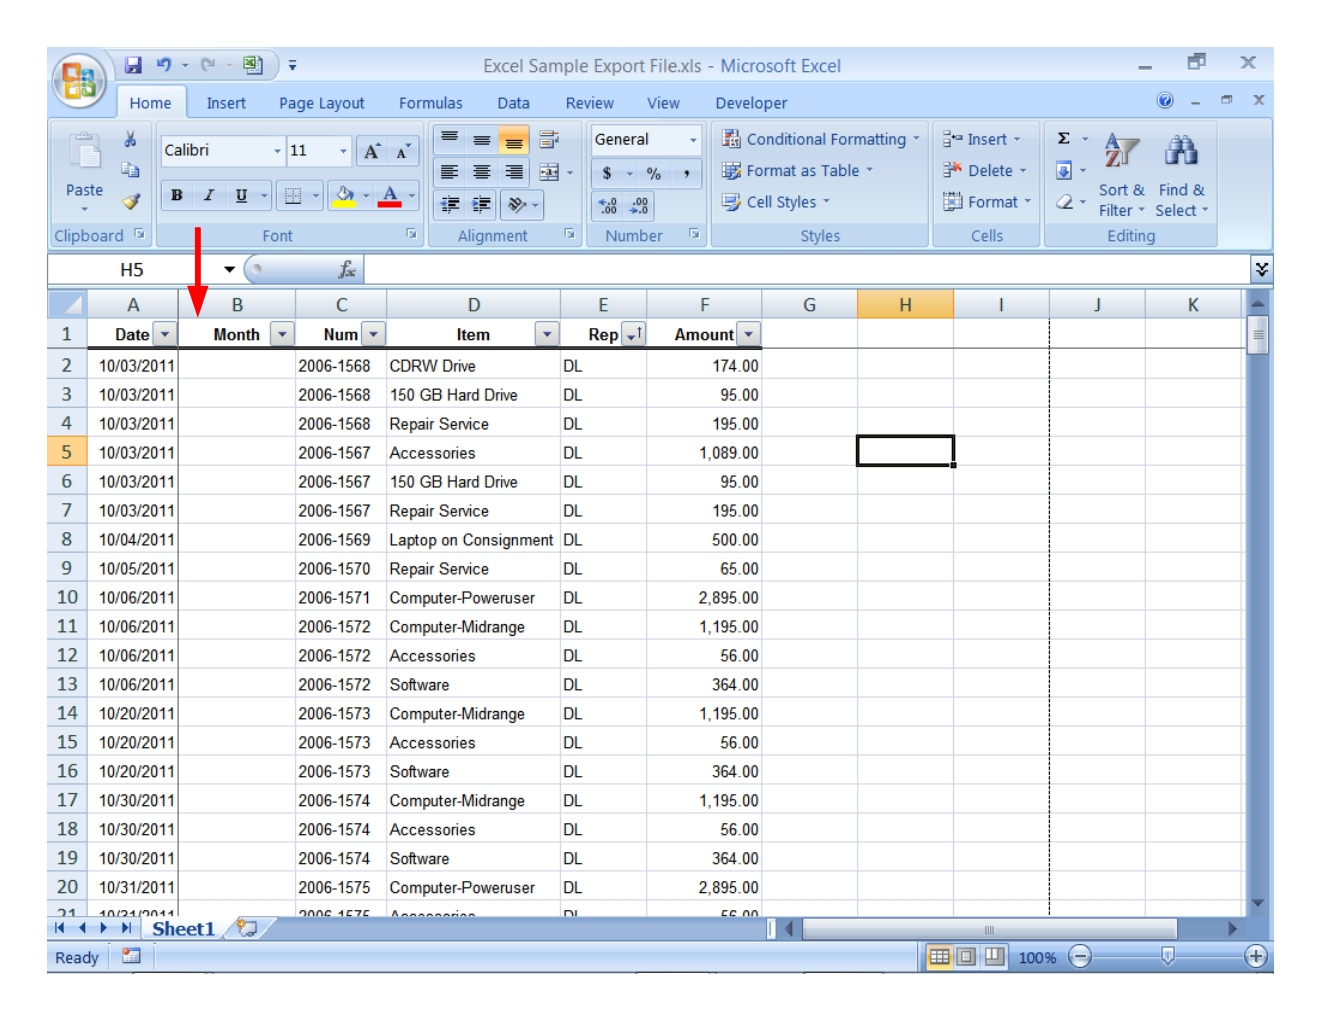
- Column Headers: Input clear and descriptive headers for each column. This should match your data categories from Step 1.
- Data Types: Format cells appropriately. For example, apply date formats to date columns, and currency formats where necessary.
- Freeze Panes: Use Excel’s ‘Freeze Panes’ feature to keep headers visible when scrolling through large datasets.
🔍 Note: Ensure that your headers are concise but descriptive to avoid confusion when analyzing data later.
Step 3: Enter Data Consistently

The consistency of data entry is paramount for effective data analysis:
- Data Validation: Use Excel’s data validation tools to limit what users can enter in cells, reducing errors.
- Drop-Down Lists: Implement drop-down lists for fields with limited options (e.g., product types, departments).
- Consistent Formatting: Ensure dates, numbers, and text follow a set format throughout the sheet.
- Data Validation Checks: Regularly perform checks for data integrity, spotting anomalies or inconsistencies.
| Field | Data Type | Validation Rule |
|---|---|---|
| Date of Sale | Date | 1/1/2000 to Current Date |
| Product Name | List | List of available products |
| Quantity | Number | Between 1 and 100 |

Step 4: Use Formulas and Conditional Formatting

To make your data sheet dynamic and insightful, leverage Excel’s formulas and formatting:
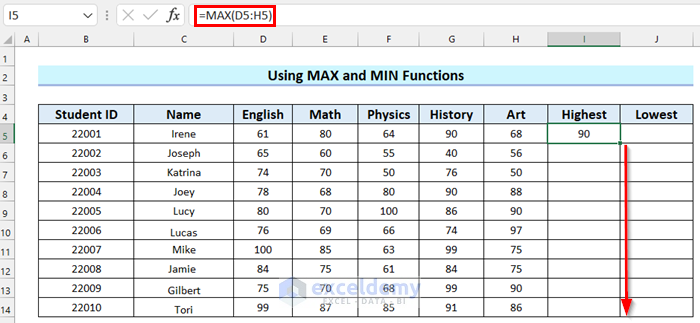
- Formulas: Utilize basic arithmetic operations, SUM, AVERAGE, COUNT, and more complex functions like VLOOKUP or INDEX-MATCH for data analysis.
- Conditional Formatting: Highlight key data points based on conditions, like overdue tasks or high sales figures.
- Named Ranges: Assign names to specific cells or ranges to simplify formula usage and increase readability.
📌 Note: Using conditional formatting can significantly enhance data visualization, making important trends or anomalies stand out immediately.
Step 5: Review, Refine, and Automate

The final step involves reviewing and refining your data sheet:
- Review: Cross-check your data for accuracy. Ensure formulas and conditional formatting are working as intended.
- Refine: Look for areas to optimize your sheet. This could involve merging cells, adjusting column widths, or updating headers.
- Automate: Consider automating repetitive tasks with macros or Power Query for data import and manipulation.
The process of crafting an Excel data sheet is iterative. Your initial setup might need adjustments as your data or analysis requirements evolve. This flexibility is what makes Excel such a powerful tool for data management. By following these five steps, you’re not only organizing data but also setting up a framework for dynamic analysis and insights.
To summarize, the key to creating an effective Excel data sheet lies in meticulous planning, consistent data entry, the strategic use of Excel’s tools, and continuous improvement. With these practices in place, you’ll be well-equipped to manage complex datasets, derive meaningful insights, and present your findings in a professional manner.
What if my data changes frequently?

+
Regularly review and update your Excel sheet to reflect changes. Consider using features like Power Query to automate data import and refresh routines to minimize manual updates.
Can I use Excel for data analysis beyond basic calculations?

+
Yes, Excel offers advanced data analysis tools like PivotTables, Solver, What-If Analysis, and Power Pivot for handling complex data sets and performing sophisticated analysis.
What is the best way to share an Excel data sheet with team members?

+
Excel files can be shared via OneDrive, where team members can collaborate in real-time, or through email. For larger datasets, consider using Excel Online or other cloud-based solutions for seamless collaboration.