5 Easy Ways to Organize Excel with Columns and Rows

Managing large amounts of data in Microsoft Excel can seem like a daunting task at first. With numerous rows and columns, information can easily become overwhelming. However, organizing your data efficiently can transform your Excel experience from chaotic to clear and manageable. In this blog post, we'll dive into five easy ways to organize Excel with columns and rows, ensuring that your data is not only accessible but also presented in a way that enhances analysis and decision-making processes.
1. Use AutoFit for Consistent Column Width

One of the simplest tricks to keep your Excel sheet neat and readable is to use the AutoFit feature for columns and rows. Here’s how you can do it:
- Select the column or row you wish to resize.
- Right-click and choose AutoFit Column Width or AutoFit Row Height from the context menu.
- Alternatively, you can double-click the boundary between two column headings or row numbers to automatically adjust the width or height to fit the content.
📏 Note: This method ensures that your data remains visible, avoiding cut-off text or squished data.
2. Freeze Panes for Navigation

When dealing with extensive data sets, you might lose sight of headers as you scroll. To maintain your orientation:
- Go to the ‘View’ tab on the Ribbon.
- Click ‘Freeze Panes’ and choose from the options:
- Freeze Top Row: Keeps the first row visible.
- Freeze First Column: Maintains the first column in view.
- Freeze Panes: Locks specific rows and columns together.
❄️ Note: Use Freeze Panes to keep headers in place while scrolling through data, providing a reference point as you navigate through your dataset.
3. Group Data with Outline and Subtotal

Group related data to make it easier to manage:
- Select the rows or columns you want to group.
- Navigate to the ‘Data’ tab, then click ‘Group’ under ‘Outline’. You can also use ‘Subtotal’ for numerical data:
- Choose your data, go to ‘Data’, and select ‘Subtotal’.
- Specify the function (Sum, Average, etc.) and the column to apply it to.
- Collapsed grouped rows will show a summary when collapsed, making it easier to navigate through large datasets.
| Step | Action |
|---|---|
| 1 | Select data for grouping |
| 2 | Apply Group/Subtotal |
| 3 | View summary on collapse |

4. Sort and Filter for Better Organization

Sorting and filtering are essential tools for data organization:
- Sort:
- Select the data range to sort.
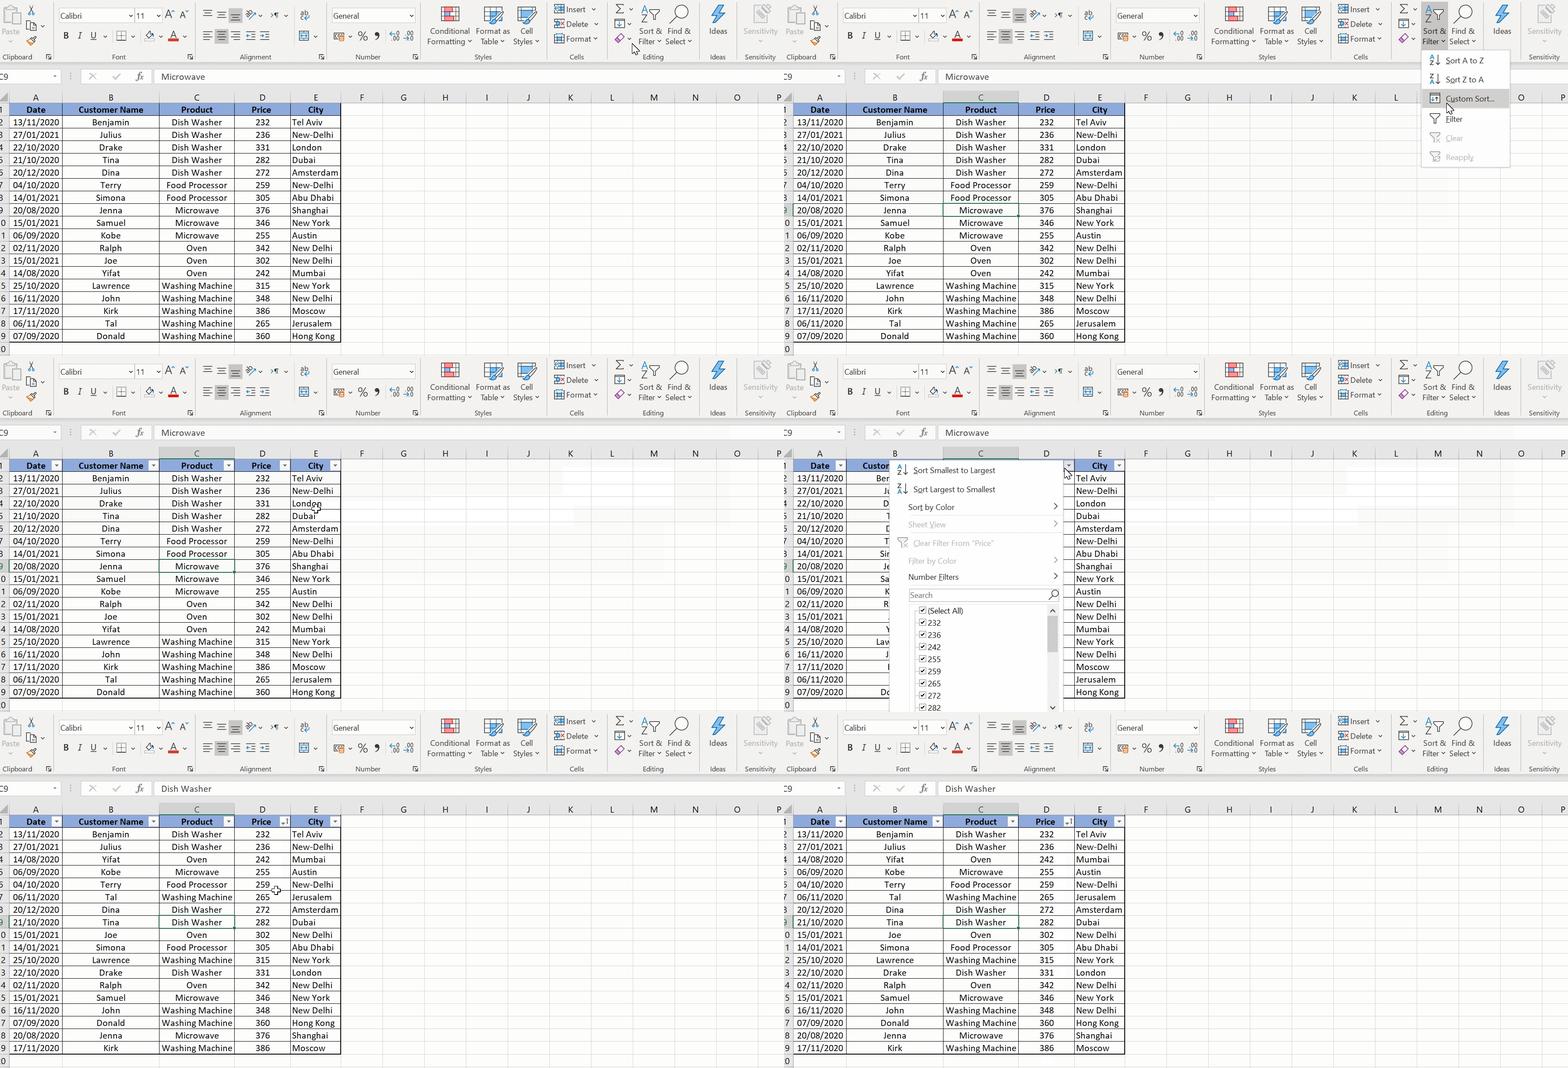
- Go to ‘Home’ > ‘Sort & Filter’ > ‘Sort’, and specify your sort criteria.
- Filter:
- Select your data range.
- Go to ‘Home’ > ‘Sort & Filter’ > ‘Filter’ to show drop-down lists in headers, allowing you to filter data by specific criteria.
5. Create Named Ranges for Easy Reference

Names make formulas and data reference simpler:
- Select the range you want to name.
- Go to the ‘Formulas’ tab and click ‘Define Name’, or use ‘Name Manager’ for existing names.
- Enter a name for your range, ensuring it starts with a letter and has no spaces.
Throughout this guide, you've seen practical ways to enhance data organization in Excel. By consistently applying these methods, you'll be able to navigate, analyze, and present your data effectively, leading to better insights and decisions. Remember, Excel's versatility extends beyond basic organization, with features that cater to complex data management needs.
What does AutoFit do in Excel?

+
AutoFit automatically adjusts the width of columns or height of rows to fit the largest item in each column or row, ensuring that all data is visible and well-organized.
Can I undo freezing panes?

+
Yes, to undo frozen panes, go to the ‘View’ tab and click ‘Freeze Panes’. From the dropdown, select ‘Unfreeze Panes’ to remove any frozen panes in your workbook.
Why should I use named ranges?

+
Named ranges make referencing data in formulas easier to read and manage. They also allow you to update data in one place, and all related formulas will automatically reflect the changes.