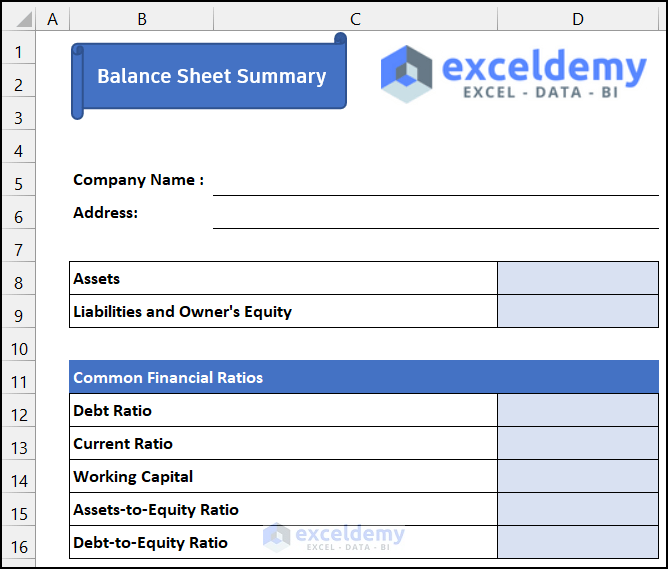
5 Steps to Create a Balance Sheet in Excel 2010

Creating a balance sheet in Microsoft Excel 2010 is an essential skill for business owners, financial analysts, and students studying accounting. A balance sheet provides a snapshot of a company's financial health by summarizing its assets, liabilities, and owner's equity at a specific point in time. Here's a step-by-step guide to creating a detailed balance sheet that's both functional and visually appealing.
1. Open Excel and Prepare Your Workbook

- Open Microsoft Excel 2010.
- Create a new workbook by clicking on 'File' then 'New' from the menu or use the shortcut Ctrl + N.
- Name your workbook appropriately, for example, "Company Balance Sheet 2023" by clicking on 'File' > 'Save As'.
📝 Note: Regularly saving your work is crucial to avoid data loss.
2. Set Up Your Worksheet

- Label three columns: 'Assets', 'Liabilities', and 'Equity'. You can do this by selecting cell A1, typing 'Assets', then moving to C1 for 'Liabilities', and E1 for 'Equity'.
- Under each heading, you'll list various accounts that fall into each category. Below 'Assets', you might have rows for 'Cash', 'Accounts Receivable', 'Inventory', etc.
3. Input Your Data

- Enter the dollar amounts for each account in the corresponding cells. For example, under 'Cash' in the 'Assets' column, you would enter the current cash balance.
- Use consistent formatting for numbers, making them easily readable. You might want to:
- Right-align your monetary figures for uniformity.
- Format numbers as currency using the format options in the 'Home' tab under 'Number'.
4. Calculate Totals and Subtotals

- To calculate the total for each section, use the 'SUM' function. For instance, if your Assets are listed from A2 to A10, in cell A11, you would enter:
=SUM(A2:A10) - Apply the same approach to calculate the total for Liabilities and Equity.
- Ensure that the total of Liabilities and Equity equals the total of Assets. This is the fundamental accounting equation (Assets = Liabilities + Equity).
⚙️ Note: Use the formula bar to adjust or correct any errors in the data input or calculations.
5. Enhance Presentation with Formatting and Graphics

- Formatting:
- Use bold or italics for headings or important figures.
- Apply different colors to distinguish sections. For example, use green for Assets, red for Liabilities, and blue for Equity.
- Utilize borders and gridlines to separate sections clearly.
- Graphics:
- Insert bar or pie charts to visually represent the balance sheet. Select the range of cells you want to chart, then go to the 'Insert' tab, and choose the chart type.
- Ensure labels and legends are clear on your charts for easy interpretation.
By following these steps, you'll be able to craft a balance sheet that not only serves its functional purpose but also does so with professional flair. This balance sheet will provide critical insights into the financial health of the business or project you're analyzing, facilitating better financial decision-making.
What are the key components of a balance sheet?

+
The key components are Assets (what the company owns), Liabilities (what the company owes), and Equity (owner’s investment and retained earnings).
How do I ensure my balance sheet is accurate?

+
Ensure the sum of Liabilities and Equity equals the total of Assets. Regularly reconcile accounts and use Excel’s built-in error checking tools to catch common mistakes.
Can I use templates for balance sheets?

+
Yes, there are many free templates available online for balance sheets in Excel. However, customizing your own can be beneficial for learning and ensuring it meets your specific needs.