Excel Overview Sheet Creation Guide for Beginners

Excel Overview Sheet Creation Guide for Beginners

In today's data-driven world, Excel spreadsheets are indispensable tools for organizing, analyzing, and presenting information. Whether for business, personal finance, or academic purposes, understanding how to create an effective overview sheet in Excel can enhance your productivity significantly. This guide will walk you through the steps to create a comprehensive Excel overview sheet, focusing on simplicity and efficiency for beginners.
What is an Excel Overview Sheet?

An Excel overview sheet serves as a summary page that provides a snapshot of the key data or metrics from the entire workbook. It's typically used to quickly convey the most important information without the need to navigate through multiple sheets. Here's what you can expect in an overview sheet:
- Summarized data
- Key performance indicators (KPIs)
- Charts and graphs
- Dashboard elements
Setting Up Your Workbook

Before diving into the creation of your overview sheet, you'll want to ensure your workbook is structured properly:
- Organize Your Data: Make sure each worksheet contains data that can be summarized effectively.
- Use a Consistent Format: Apply uniform formatting across sheets to maintain readability.
- Check for Accuracy: Ensure all data is accurate and updated before creating summaries.
Steps to Create an Excel Overview Sheet

Let's break down the process into actionable steps:
1. Plan Your Overview Sheet

- Identify Key Metrics:
- Decide which data points or KPIs you want to highlight. Examples might include sales figures, financial totals, customer counts, etc.
- Visualize Layout:
- Sketch or visualize how you want your overview sheet to look. Consider space for text, charts, and tables.
2. Set Up Your Overview Sheet

- Insert a New Sheet:
- Go to the ‘+’ tab in Excel to add a new sheet for your overview.
- Name the Sheet:
- Right-click on the sheet tab and rename it, e.g., “Summary,” “Dashboard,” or “Overview.”
3. Creating Summaries

- Link Data:
- Use functions like
=Sheet2!A1to pull data from other sheets. For dynamic linking, consider using=INDIRECT(“Sheet”&ROW(A1)&“!A1”)for row-dependent references. - Summarize with Formulas:
- Employ SUMIF, AVERAGEIF, or COUNTIF to summarize data based on conditions. For example,
=SUMIF(A:A, “Completed”, B:B)for summing up completed tasks.
4. Visualizing Data

- Charts:
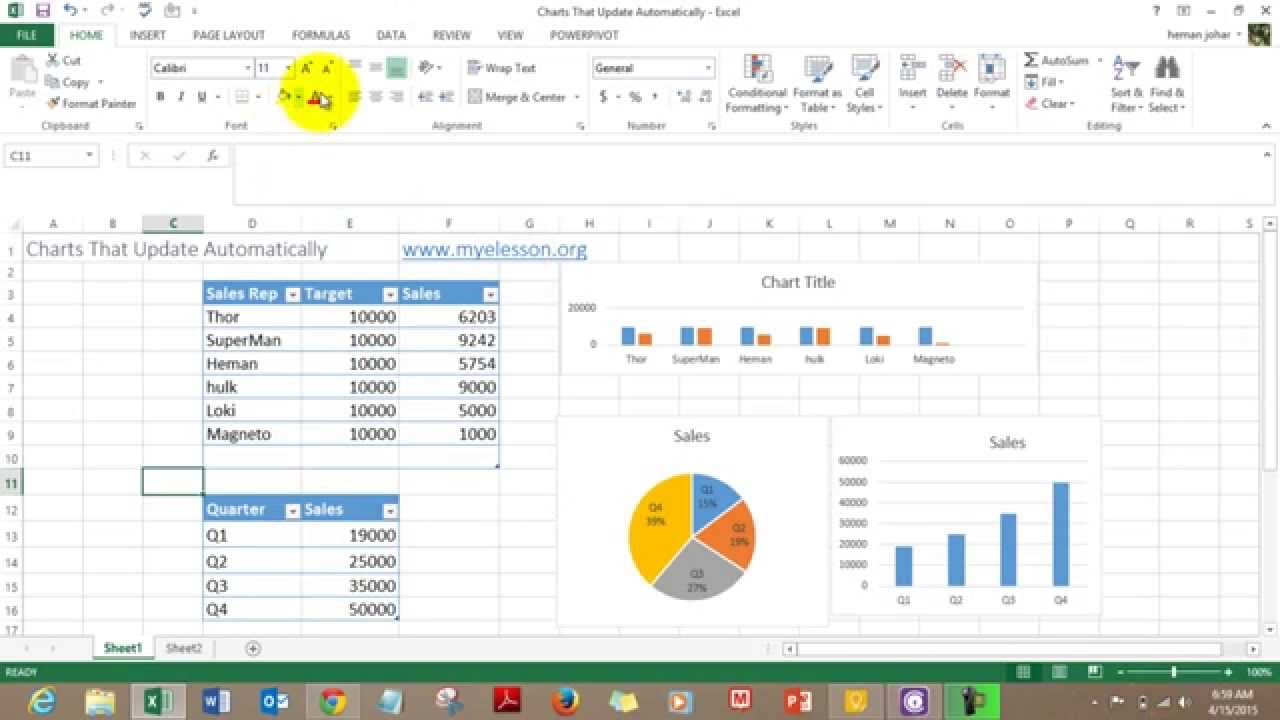
- Use the ‘Insert’ tab to create pie charts, line graphs, or bar charts to visually represent your data.
- Dashboard Elements:
- Create sparklines for quick trend visuals or use conditional formatting for heat maps to highlight key areas.
5. Enhancing Usability

- Navigation:
- Hyperlink to other sheets for easy navigation, using
=HYPERLINK(“#Sheet1!A1”, “Go to Sheet 1”). - Formulas for Interactive Elements:
- Use conditional formatting or data validation to make the overview interactive. For example, a dropdown list to select different metrics or time periods.
Table: Excel Formulas for Overview Sheets

| Function | Use Case | Example |
|---|---|---|
| SUM | Calculate the total of a range | =SUM(A1:A10) |
| SUMIF | Sum based on a condition | =SUMIF(A:A, "Completed", B:B) |
| AVERAGE | Find the average of numbers | =AVERAGE(A1:A10) |
| COUNTIF | Count cells that meet criteria | =COUNTIF(A:A, "Completed") |
| INDIRECT | Create dynamic references | =INDIRECT("Sheet"&ROW(A1)&"!A1") |

🌟 Note: Formulas used should be adapted to your specific data layout for accurate results.
Wrapping Up Your Overview Sheet

After following these steps, you'll have created a functional and visually appealing Excel overview sheet. Here are some final touches you might consider:
- Check for Consistency:
- Ensure all data aligns correctly and formulas update as intended.
- User Interaction:
- Add comments or tooltips for user guidance or additional context.
With your Excel overview sheet, you've not only streamlined the way you present and analyze data but also provided a powerful tool for decision-making processes. Whether for personal use, reporting to stakeholders, or within a team setting, an overview sheet can transform raw data into actionable insights at a glance.
Can I update my overview sheet automatically when the source data changes?

+
Yes, by using formulas like INDIRECT and ensuring your source data is updated, your overview sheet will reflect these changes dynamically.
How can I add security to my Excel overview sheet?

+
You can protect your sheet by setting a password through Excel’s ‘Review’ tab. This will prevent unauthorized edits or views, though viewers can still print or copy data unless further restricted.
What should I do if my Excel file becomes too large?

+
Consider techniques like reducing the number of sheets, using external links to minimize internal data, or summarizing only the most critical information on your overview sheet. Also, Excel’s ‘Data Model’ can manage large datasets efficiently.