5 Easy Steps to Create an Excel Data Sheet

Introduction to Excel Data Sheets

Excel, Microsoft's powerful spreadsheet application, stands as a cornerstone for data analysis, organization, and presentation in countless industries around the world. Whether you're compiling financial data, organizing inventory, or managing a database, creating an effective Excel data sheet can transform raw data into actionable insights. This guide will walk you through five easy steps to create an Excel data sheet, ensuring your data is not only well-organized but also easy to navigate and analyze.
Step 1: Plan Your Data Layout

Before diving into Excel, planning is crucial for a well-organized data sheet:
- Define Purpose: Understand the primary use of your data sheet. Will it be for financial reporting, customer management, or sales tracking?
- Identify Necessary Fields: List all the data elements you want to include. For instance, if it's an inventory sheet, fields might include Item Name, Quantity, SKU, Category, and Price.
- Plan Structure: Sketch or conceptualize how your data will look. Think about headers, columns, rows, and whether you'll need to add formulas or charts.
📝 Note: Spending time planning your layout can save you from making major changes later which could disrupt your workflow.
Step 2: Setting Up Your Workbook


Launch Excel and get ready to set up your workbook:
- Open a new Excel document or use an existing template if it fits your needs.
- Label each sheet tab to represent different categories or types of data you plan to enter. For example, "Sales," "Expenses," "Inventory."
- Select the appropriate tab and begin structuring your data sheet.
Step 3: Inputting Data

Now you'll start filling in your data:
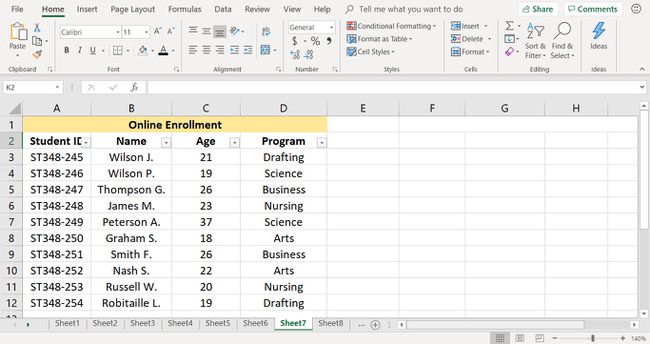
- Headers: Enter your field names in the top row (Row 1). This helps in understanding what each column represents.
- Enter Data: Begin entering data row by row. Ensure that data types are consistent within columns (e.g., all numbers in the quantity column).
- Formatting: Use formatting options like bold text for headers or number formatting for numeric data.
- Data Validation: If applicable, set up data validation rules to control what kind of data can be entered into specific cells.
Here's an example of how you might format your data:
| Item Name | Quantity | SKU | Category | Price |
|---|---|---|---|---|
| Laptop Charger | 50 | CHG123 | Electronics | $25.00 |
| USB Drive | 100 | USB001 | Accessories | $10.00 |

Step 4: Formatting and Data Management

Once your data is in place, enhance the usability with formatting:
- Conditional Formatting: Highlight key data points or make errors stand out by using color scales, data bars, or icon sets.
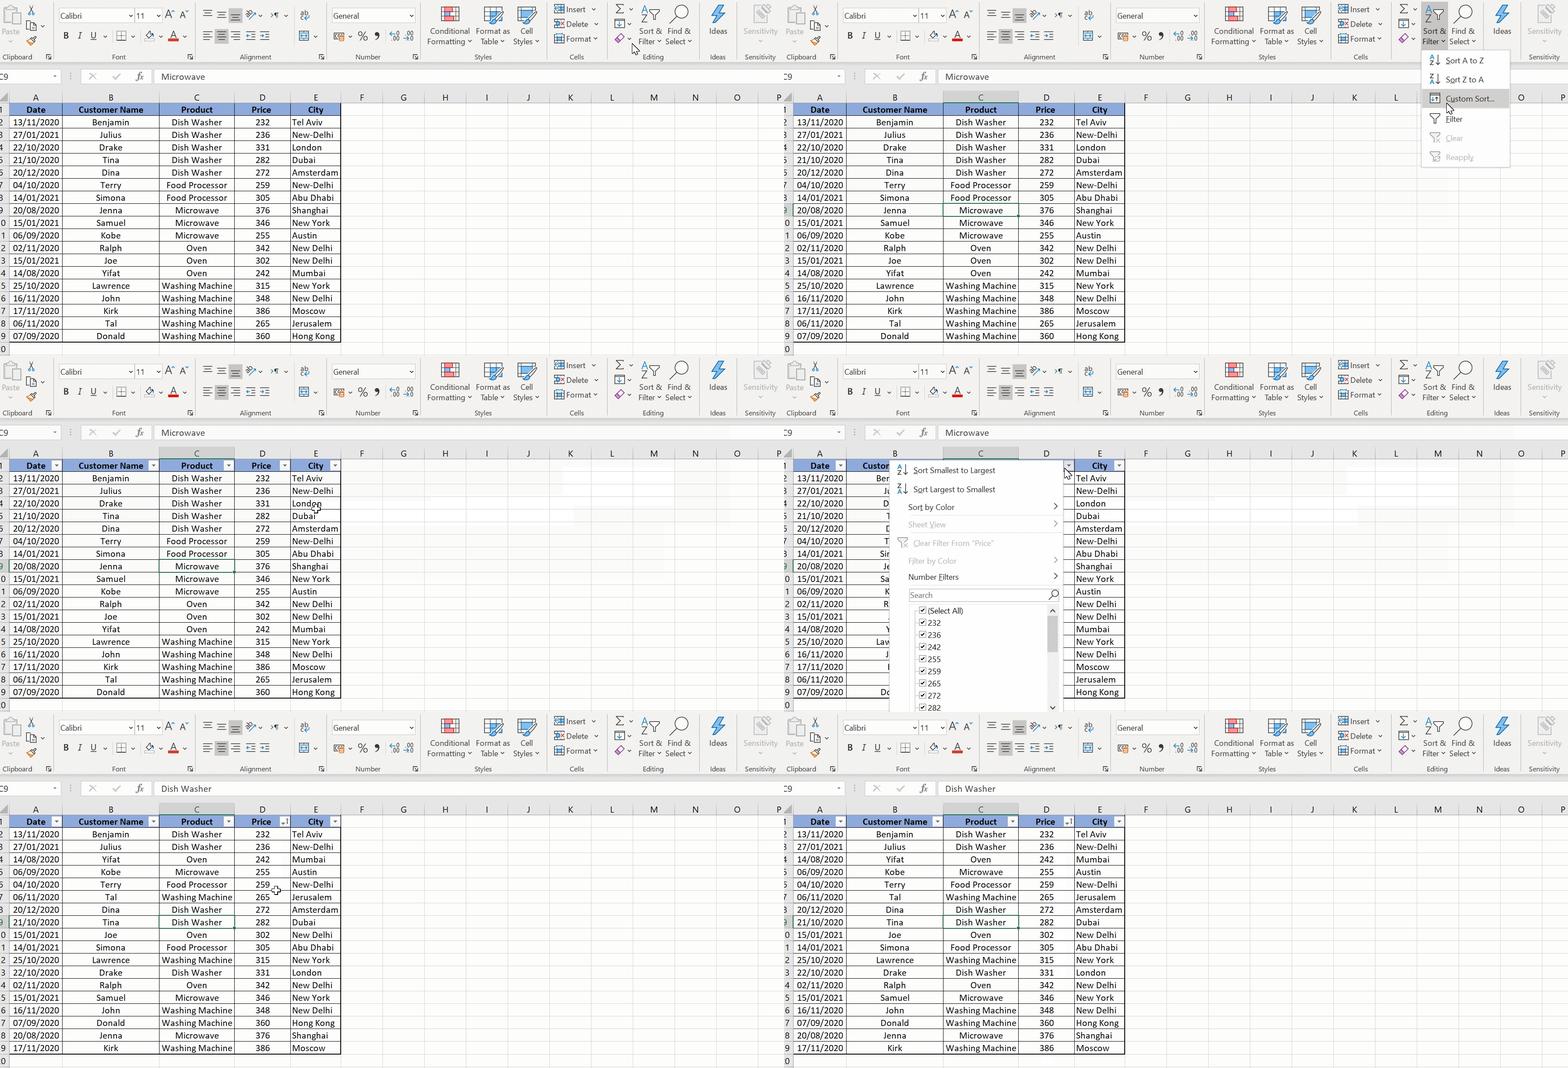
- Sort and Filter: Use Excel's sort and filter capabilities to make data analysis easier. This is particularly useful for large datasets.
- Formulas and Functions: Implement calculations like SUM, AVERAGE, or more complex formulas to derive insights from your data.
🔍 Note: Use keyboard shortcuts to streamline your work. For example, Ctrl + S to save your progress, or Ctrl + B to bold selected text.
Step 5: Protecting and Sharing Your Data

Lastly, ensure your data sheet is secure and shareable:
- Protect Workbook: Use Excel's protection features to prevent unintended changes. You can lock cells, protect sheets, or even encrypt the entire workbook.
- Sharing: Consider how you'll share the data. Will it be as an Excel file or exported to another format like CSV or PDF?
- Collaboration: If collaboration is required, use Excel's co-authoring feature or share the file on cloud platforms like OneDrive or SharePoint.
Your data sheet should now be fully operational, organized, and protected.
By following these steps, you've created an Excel data sheet that's not only effective but also user-friendly. With planning, proper data entry, formatting, and protection, your Excel sheet will be a valuable asset for any data-driven task or analysis. Whether for personal use, managing small businesses, or handling complex corporate data, these techniques ensure that your Excel data sheets are structured to deliver the information needed in a clear and concise manner.
What is the best way to organize data in Excel?

+
The best way to organize data in Excel is to start by defining clear column headers for each type of data you will track. Use separate tabs or sheets for different categories of data, ensuring each sheet has a logical structure. Utilize sorting, filtering, and grouping to manage larger datasets effectively.
Can I use Excel for complex data analysis?

+
Absolutely! Excel offers powerful tools like PivotTables, advanced filters, and an extensive library of functions that allow for sophisticated data analysis, from statistical modeling to financial forecasting.
How can I prevent data entry errors in Excel?

+
Use data validation rules to restrict the type of data entered into cells. Additionally, employ conditional formatting to highlight discrepancies or potential errors, and always double-check formulas and functions for accuracy.