Excel Gradient Guide: Create Stunning Sheets Easily

Whether you're a data analyst, a financial planner, or just someone who loves organizing personal data, Microsoft Excel has proven to be an indispensable tool for managing and visualizing information. However, many users aren't aware of one of Excel's powerful features for aesthetic enhancement—gradient fills. Gradients can transform a mundane spreadsheet into a visual masterpiece, making data presentation not only more appealing but also more intuitive. In this guide, we'll delve into how you can use gradients in Excel to create stunning sheets with ease.
What are Gradients and Why Use Them in Excel?

Gradients are smooth transitions between colors that give a sense of depth and movement in design. In Excel, gradients can:
- Highlight key data points or trends.
- Make your sheets more visually appealing, which can help in retaining audience interest during presentations.
- Serve as a form of data visualization, where color gradients can represent different values or conditions.
How to Add Gradients to Cells

Let’s walk through the process of adding gradients to cells:
- Select the Cells: Click and drag to select the cells where you want to apply the gradient.
- Navigate to Format Cells: Right-click the selected cells, choose ‘Format Cells’, or press Ctrl+1 for a keyboard shortcut.
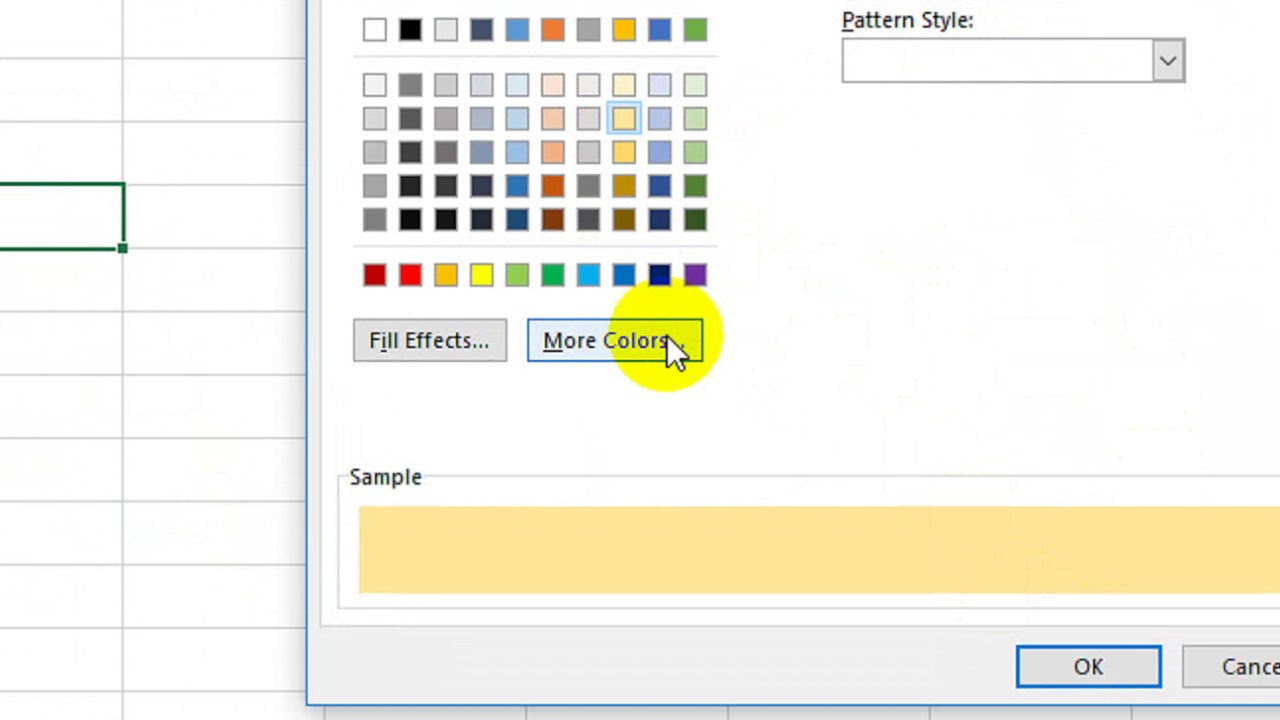
- Access Fill Effects: In the ‘Format Cells’ dialog box, click on the ‘Fill’ tab and then on ‘Fill Effects’.
- Choose Gradient Type: Select from ‘One color’, ‘Two colors’, or ‘Preset colors’. You can further customize the direction of the gradient.
- Adjust Color Stops: For more control, you can add or remove color stops, choosing colors and their positions in the gradient.
- Apply: After setting your gradient, click ‘OK’ twice to apply the gradient fill to the selected cells.
❗ Note: Gradient fills in Excel are not printed as they appear on-screen. If you need to print a document with gradients, consider using images or exporting to PDF.
Using Gradient Scales for Data Visualization

Gradient scales can be incredibly useful for visualizing data across a spectrum:
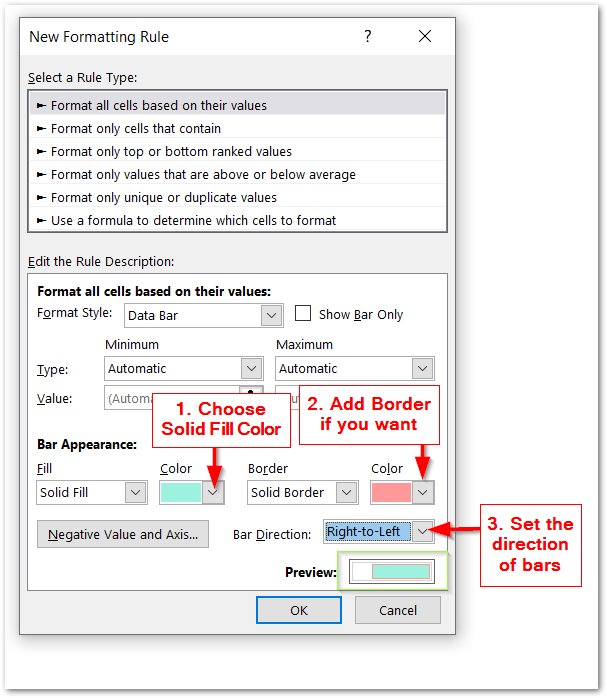
- Open the ‘Conditional Formatting’ menu from the ‘Home’ tab.
- Choose ‘Color Scales’ from the ‘New Rule’ options.
- Set the minimum, midpoint, and maximum values for your data, selecting gradient colors for each.
This feature allows you to see at a glance where data falls within a range, making it easier to spot trends or outliers.
Advanced Gradient Techniques

Beyond basic cell fills, here are some advanced techniques:
Text with Gradient Fill

While Excel does not natively support gradient fills for text, you can achieve this effect with:
- Using WordArt: Insert WordArt, set the text to gradient fill, then copy and paste as a picture into your Excel sheet.
- Third-Party Add-ins: Some add-ins provide gradient fill options for text directly within Excel.
Using Gradient Borders

Excel doesn’t support gradient borders, but you can simulate them by:
- Creating separate shapes or lines with gradient fills and placing them as borders.
- Merging cells and adding thick, gradient-filled lines.
Creating Gradient Backgrounds

To make a cell background look like a gradient:
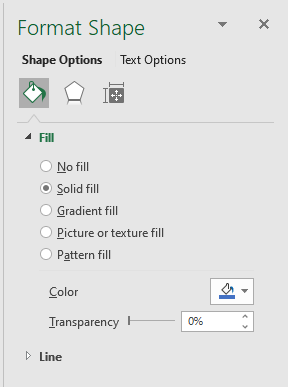
- Insert a rectangle shape over your cells, fill it with a gradient, and send it to the back.
- Use this to highlight specific sections or create a professional background for your data.
💡 Note: When using shapes for gradients, ensure you adjust the transparency to make text readable over the gradient background.
Ensuring Data Readability with Gradients

While gradients can make sheets visually appealing, readability must be considered:
- Color Contrast: Use colors with sufficient contrast for text and background gradients.
- Gradient Direction: Horizontal gradients are easier to read than vertical ones.
- Text Color: Choose text colors that stand out from the gradient background.
- Cell Spacing: Increase cell padding to prevent the gradient from encroaching on text.
In summary, by thoughtfully integrating gradients into your Excel sheets, you can enhance both their visual appeal and the communicative power of your data. Gradients not only make your sheets stand out but also aid in emphasizing important information, making your data analysis more effective and your presentations more engaging. Keep these tips in mind to create stunning sheets that are both informative and visually compelling.
How do I remove a gradient from a cell in Excel?

+
To remove a gradient from a cell, simply select the cell(s), go to ‘Format Cells’ > ‘Fill’ tab, and choose ‘No Fill’ or ‘Solid Fill’ to revert back to a flat color or transparency.
Can I create custom gradient scales for data visualization?

+
Yes, you can customize gradient scales in conditional formatting by setting specific colors for minimum, midpoint, and maximum values, allowing you to represent your data visually as needed.
What are some common mistakes to avoid when using gradients?

+
Common mistakes include overusing gradients, which can clutter the sheet, selecting colors with insufficient contrast, and not adjusting text color appropriately, leading to readability issues.