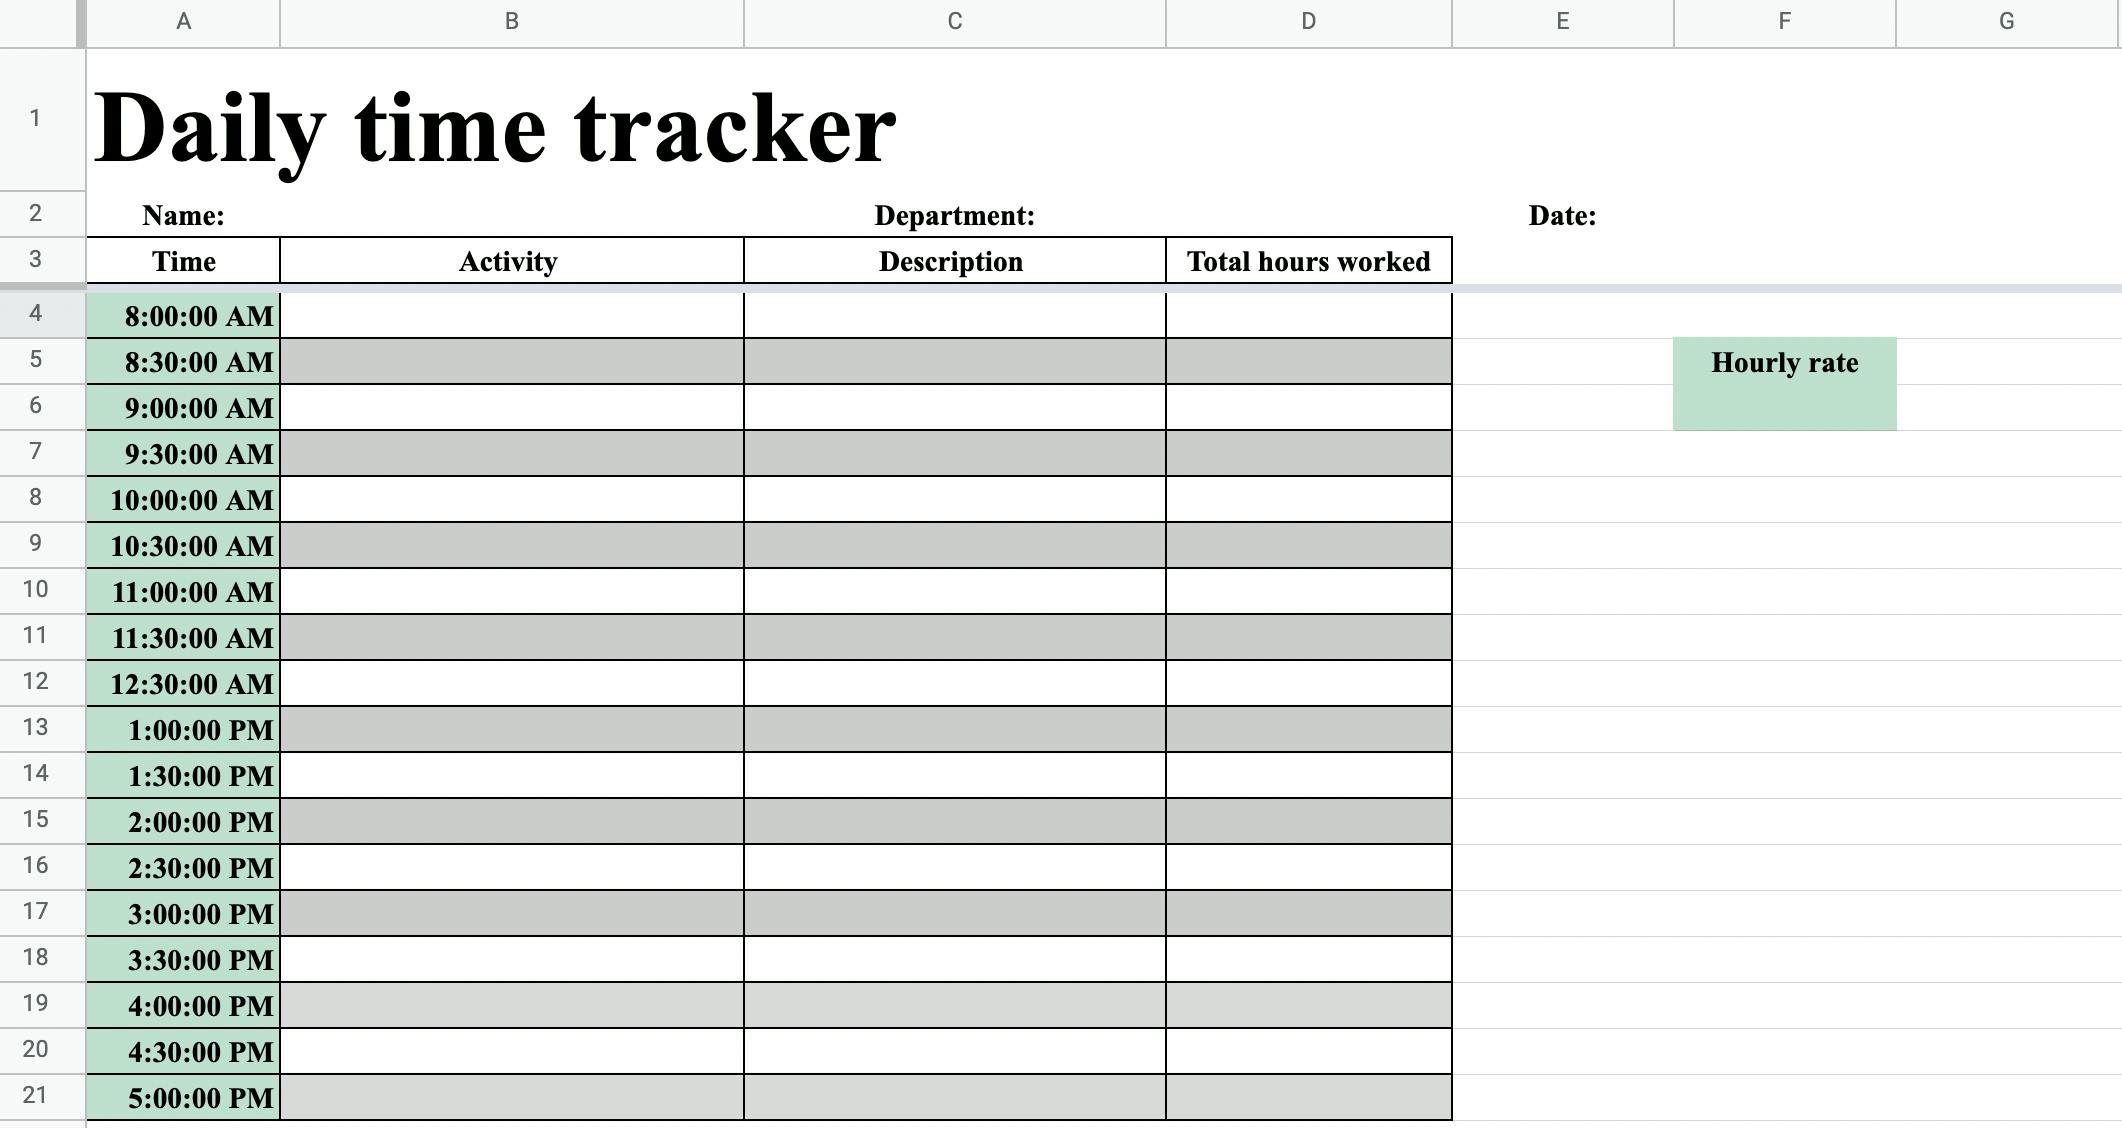
Excel Entry Tracking Sheet: A Simple Guide

Introduction to Excel Tracking Sheet
Excel sheets are not just spreadsheets; they are powerful tools for organizing, analyzing, and tracking data. Tracking entries in Excel can seem daunting at first, but with the right approach, it becomes an asset for any user from beginners to seasoned data analysts. Whether you're tracking project deadlines, expenses, or inventory, Excel's versatility can make your life much easier.
Why Use Excel for Tracking?

Excel is an excellent choice for tracking due to its:
- Flexibility: Customize your tracking system to meet specific needs.
- Computational Power: Perform complex calculations and analyses.
- Accessibility: Widely used and easy to access or share with others.
- Data Visualization: Create charts and graphs to visualize data.
![]()
Setting Up Your Tracking Sheet
Let’s dive into how you can set up a simple entry tracking sheet in Excel:
1. Plan Your Sheet Structure
Before diving into Excel, take a moment to:
- Identify the data you want to track.
- Decide what information is necessary for each entry.
2. Create the Table

To start:
- Open Excel and create a new workbook.
- Name your worksheet or use the default “Sheet1”.
- Set up the table headers for your entries. Here’s a typical structure:
| Date | Item | Description | Category | Quantity | Unit Price |
|---|---|---|---|---|---|
| [01/01/2023] | [Product Name] | [A brief description] | [Category or department] | [How many] | [Price per item] |
3. Data Entry
Begin entering your data:
- Ensure consistency in date format and data entry.
- Use lists or drop-downs for categories where applicable.
- Apply conditional formatting for better data visualization.
4. Formulas for Automated Tracking
To make your tracking sheet dynamic:
- Use the
SUMfunction to calculate totals. - Employ
COUNTIForSUMIFfor category-specific calculations. - Create time-based alerts with
IFandTODAY().
⚠️ Note: Always verify your formulas to ensure they are returning accurate results, especially when modifying your sheet structure.
5. Data Validation and Protection
Ensure data integrity:
- Set up data validation rules to prevent invalid entries.
- Protect sheets to prevent accidental changes or data tampering.
6. Create Pivot Tables and Charts

Analyze your data with:
- Pivot tables for summarizing and analyzing data in various ways.
- Charts to visually represent trends or categories.

Conclusion

In summary, setting up an Excel tracking sheet involves thoughtful planning, efficient data entry, formula application, validation, and visualization. This approach not only streamlines your data management but also allows for in-depth analysis. Excel’s functionalities like conditional formatting, data validation, and pivot tables elevate it from a simple spreadsheet to a dynamic tool for tracking and analysis. With practice and a little creativity, your tracking sheets will become indispensable in managing your data-driven tasks.
What is the best way to organize categories in Excel?
+
Use drop-down lists in Excel’s Data Validation to ensure data consistency. Also, color-code categories for quick visual reference.
How do I prevent data entry errors?
+
Set up data validation rules to limit what can be entered into cells. Also, use conditional formatting to highlight unusual entries.
Can Excel track time-sensitive data automatically?
+
Yes, by using formulas like IF(TODAY()>, you can set up alerts or notifications for dates that are approaching or have passed.
How do I make my tracking sheet interactive for other users?
+
Utilize features like Data Validation, Forms, and Conditional Formatting. You can also share the workbook with restricted editing permissions to make it interactive while maintaining control over key sections.