3 Easy Steps to Create a New Chart Sheet in Excel

When working with Microsoft Excel, one of the most powerful features at your disposal is the ability to visualize data through charts. Creating charts within your data sheets can often lead to clutter and readability issues, which is where chart sheets come in handy. Chart sheets allow you to dedicate an entire worksheet to a single chart, providing a clean, full-screen view for analysis and presentation purposes. Here are the three easy steps to create a new chart sheet in Excel:
Step 1: Select Your Data

The first step in creating a chart sheet is to select the data you want to visualize. This can include anything from simple lists to complex datasets:
- Highlight the cells containing the data you want to chart.
- Ensure you include any headers or labels if they’re part of your dataset.
Step 2: Insert Your Chart

With your data selected:
- Navigate to the Insert tab on the Ribbon.
- Choose the type of chart you want from the Charts group. Options include Column, Line, Pie, Bar, Area, Scatter, etc.
- Click on the chart icon, and a chart will appear in your current worksheet.

Step 3: Move the Chart to a New Sheet

Now, to place the chart on its own sheet:
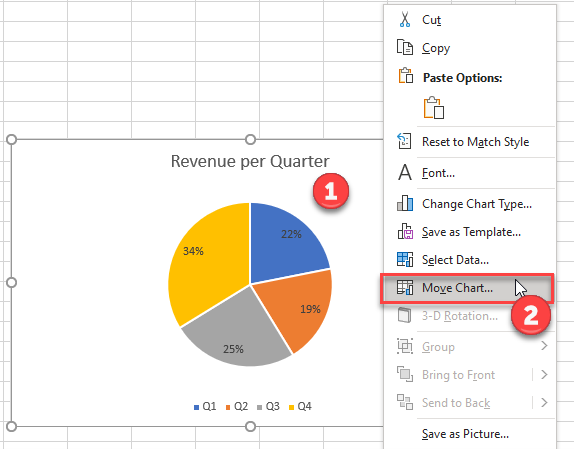
- Right-click on the chart you’ve just created.
- From the context menu, select Move Chart.
- In the Move Chart dialog box, choose New Sheet, then enter a name for the new chart sheet.
- Click OK, and your chart will now be on a separate sheet.
🔍 Note: Keep in mind that creating a chart sheet does not remove the data from your original worksheet. It merely duplicates the chart for presentation or further analysis.
Utilizing chart sheets in Excel provides several advantages:
- Cleaner Worksheets: By moving charts off your data sheets, you keep the environment uncluttered.
- Enhanced Focus: A chart sheet allows you to focus solely on the chart, making it easier to interpret and analyze data.
- Improved Presentation: When presenting your data, having charts on separate sheets can enhance the flow of your presentation, with each chart given the spotlight it deserves.
The process of creating a new chart sheet is straightforward, yet it can dramatically improve your Excel experience by enhancing the clarity and presentation of your data. Whether you're presenting in a business meeting, analyzing trends, or creating reports, chart sheets offer a dedicated space for your visualizations, making your data easier to interpret and more professional.
What is the benefit of using a chart sheet over an embedded chart?

+
Chart sheets allow you to view charts in full screen, enhancing focus on the data. They also keep your data sheets cleaner and more organized by moving charts off the main data area.
Can I edit the chart after moving it to a new sheet?

+
Yes, you can. Double-click the chart, and you’ll be able to edit the data, formatting, and other chart elements just as you would on the original worksheet.
What happens to the chart if I change the source data?

+
The chart on the chart sheet will automatically update to reflect any changes made to the original data. This provides real-time analysis.