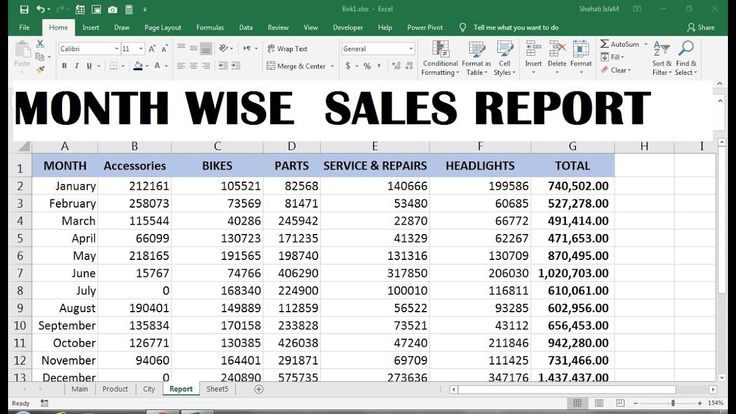
Excel Month Report Sheet: Easy Steps Guide

Mastering Excel Month Report Sheets: An Easy Guide

Excel Month Report Sheets are indispensable tools for businesses and individuals alike to keep track of finances, monitor progress, and report data efficiently. Whether you're compiling sales figures, tracking expenses, or evaluating project timelines, creating a well-structured Excel month report can streamline your workflow. Here's a comprehensive guide to help you master this useful feature of Microsoft Excel.
Why Use Excel for Monthly Reports?

Excel has been the go-to software for data analysis and reporting for decades. Here's why:
- Flexibility: Excel provides the freedom to customize your reports as per your specific needs.
- Calculations: With built-in formulas, you can automate calculations, making updates quick and accurate.
- Visualization: Charts and graphs make your data visually digestible.
- Accessibility: You can share and collaborate on reports with ease.
Steps to Create an Excel Month Report Sheet

1. Setting Up the Spreadsheet

- Open a new Excel workbook.
- Save your file with a descriptive name like “January_Sales_Report_2023”.
- Begin by structuring your workbook with sheets for each month or project.
2. Data Entry

When entering data:
- Use a logical order, starting with headers like “Date”, “Category”, “Description”, “Amount”.
- Ensure consistent formatting for each column, e.g., date format as DD/MM/YYYY.
- For numerical values, align them to the right for better readability.
📝 Note: Keep your data clean. Ensure that you don't mix text with numbers or dates in the same column to avoid formula errors.
3. Applying Formulas for Automated Calculations

- Use SUM, AVERAGE, and other functions for quick calculations. Here’s a basic example:
| Function | Description |
|---|---|
| SUM(A1:A50) | Calculates the sum of cells from A1 to A50. |
| AVERAGE(A1:A50) | Finds the average value of cells from A1 to A50. |
| VLOOKUP | Looks up a value in the first column of a table and returns a value in the same row from another column. |

4. Formatting Your Report

- Use conditional formatting to highlight key data points or trends.
- Apply cell styles to make headers and totals stand out.
- Consider freezing panes if dealing with large datasets for easier navigation.
5. Adding Charts and Graphs

- Insert charts that best represent your data, like line charts for trends, pie charts for composition, or bar charts for comparison.
- Use the Excel wizard for charts or customize them manually for better presentation.
6. Using Filters and Sorting

- Apply filters to quickly analyze specific data subsets.
- Sort data to understand the highest to lowest, oldest to newest, etc.
7. Validation and Error Checking

- Double-check your formulas and links to ensure all data references are accurate.
- Use Excel’s auditing tools like Trace Precedents and Trace Dependents to find errors.
After following these steps, you should have a well-structured, informative, and visually appealing Excel Month Report Sheet. Excel reports not only save time but also provide insights that can guide business decisions.
Can I link data from different sheets in the same workbook?

+
Yes, Excel allows you to reference data from other sheets using the '!'. For example, =Sheet1!A1 will reference cell A1 in Sheet1 from any other sheet in the workbook.
How can I protect sensitive data in my Excel reports?

+
You can protect specific cells, sheets, or the entire workbook by setting permissions, adding passwords, or using Excel's worksheet protection feature.
What if I need to report data from multiple months?

+
You can create a summary sheet that pulls data from each monthly sheet. Use formulas to consolidate or summarize the data across months for a year-end or project overview.
Through this guide, you’ve learned not only how to create an Excel Month Report Sheet but also why Excel is a powerful tool for reporting. With practice, these reports will become second nature, helping you to provide clear, actionable insights in your professional or personal life. Remember, the key is to keep your data organized, use the right tools for analysis, and present your findings in a way that resonates with your audience. Happy reporting!