5 Simple Steps to Create a Chart Sheet in Excel

Understanding how to create a chart sheet in Excel can significantly enhance your data presentation skills, making your information visually appealing and easily digestible. Excel offers a variety of chart types and customization options that can help turn raw data into a compelling visual story. Here are five simple steps to guide you through the process.
Step 1: Prepare Your Data

Before creating a chart, you need to ensure that your data is well-organized. Here’s what you should do:
- Check that your data is in a tabular format, with headers in the first row.
- Ensure there are no blank rows or columns within your data range.
- Remove any unwanted cells or data points that might skew your chart.
🚨 Note: Proper data preparation is key for accurate chart representation.
Step 2: Select Your Data

Now that your data is prepared:
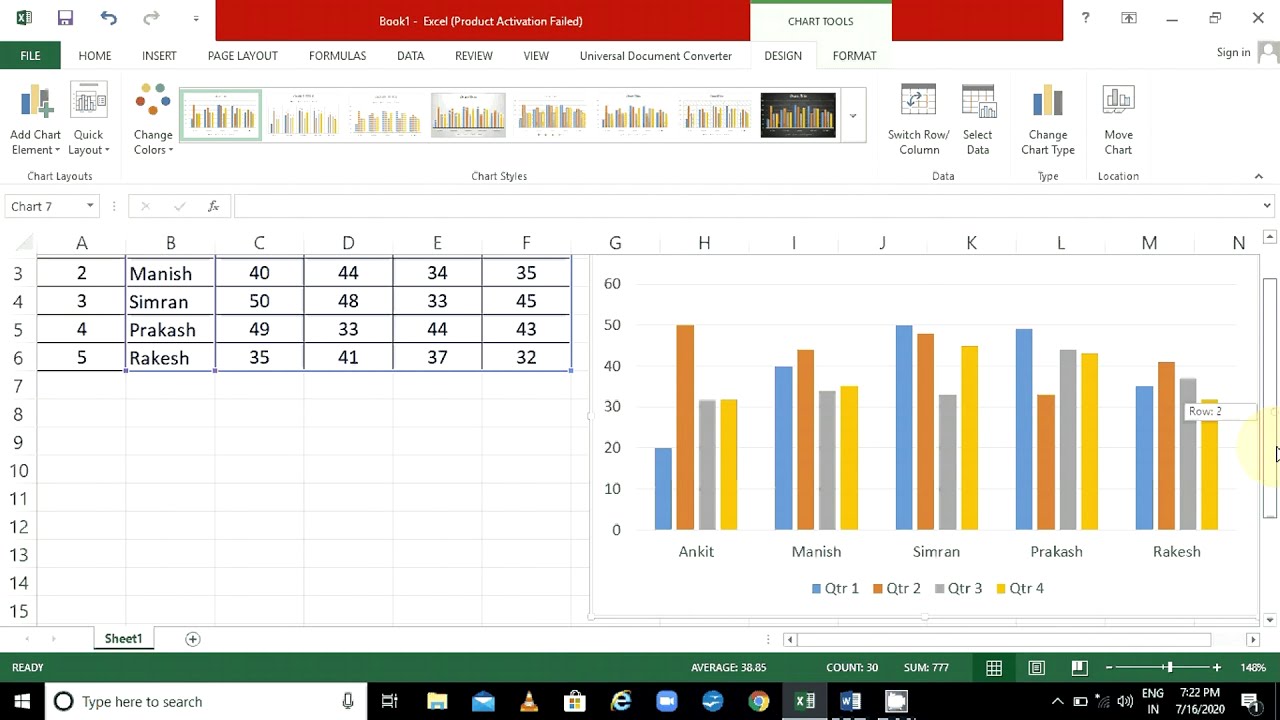
- Click and drag to highlight the cells that contain the data you want to chart, including headers.
This step is crucial because selecting the wrong data or missing headers can lead to an inaccurate chart.
Step 3: Insert Chart

With your data selected:
- Go to the Insert tab on the Excel Ribbon.
- Choose the type of chart you want from the Chart group, such as a Column, Line, or Pie chart.
| Chart Type | Best Used For |
|---|---|
| Column Chart | Comparing categories or time series data |
| Line Chart | Showing trends over continuous data |
| Pie Chart | Displaying parts of a whole |

Excel will then insert the chart into your current worksheet.
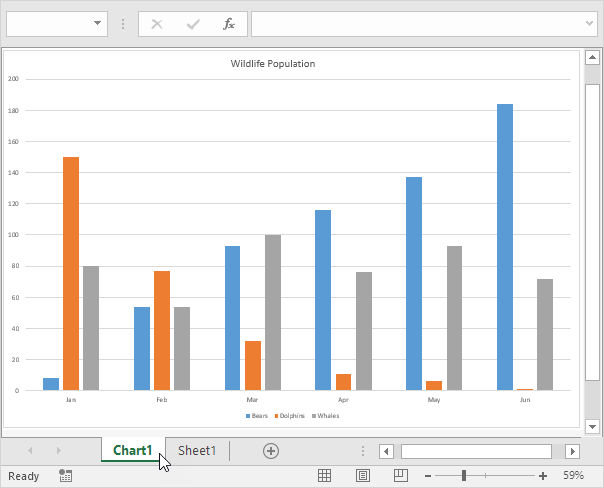
Step 4: Move Chart to a New Sheet

If you prefer your chart to be on its own sheet for better focus:
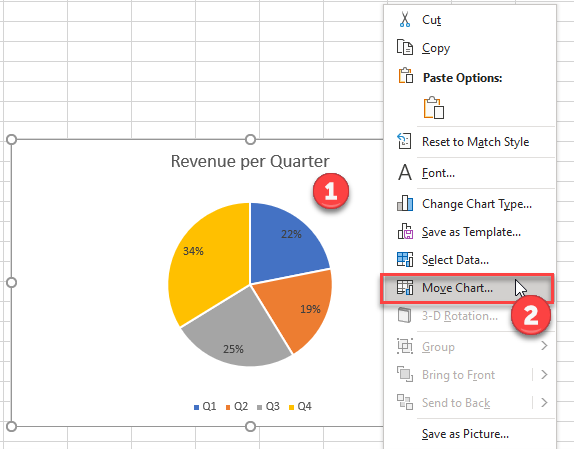
- Right-click on the chart and select Move Chart.
- In the Move Chart dialogue box, choose New sheet, then name the sheet if desired.
This action will create a dedicated chart sheet in your workbook.
Step 5: Customize Your Chart

Here are some ways to customize your chart:
- Change Chart Type: Right-click on the chart, select Change Chart Type, and choose a new type.
- Edit Chart Elements: Use the Chart Elements button to add or remove titles, labels, and legends.
- Format Data Series: Right-click on any data series to open the formatting options.
- Update Colors: Modify colors using the Color option in the Format pane.
📝 Note: Customize your chart to make it more effective for your audience.
Now that you've followed these steps, your chart should be a dynamic visual representation of your data. Remember, the key to creating an impressive chart sheet in Excel is not just about the visual appeal but also ensuring that the data is accurate and the message is clear. Whether it's for a presentation, report, or just personal use, these charts can transform complex data into understandable visuals, aiding in decision-making processes. Understanding these basics will serve as a strong foundation for further exploration into Excel's vast charting capabilities.
Why would I want to create a chart sheet?

+
Creating a chart sheet allows for a clutter-free environment where your chart is the focal point. It’s excellent for presentations or when you want to analyze the chart without distraction.
Can I change my data source after creating the chart?

+
Absolutely! You can update or change the data source at any time. Simply select the chart, go to the Design tab, and choose Select Data to modify it.
How can I make my chart interactive in Excel?

+
To make charts interactive, use features like slicers, timelines, or data filters. These allow viewers to filter or sort data within the chart dynamically.
Is there a way to quickly format my chart?

+
Yes, use the built-in chart styles and presets under the Design tab to apply pre-formatted looks quickly, or customize manually for a personalized touch.