5 Easy Steps to Create Charts from Excel Data

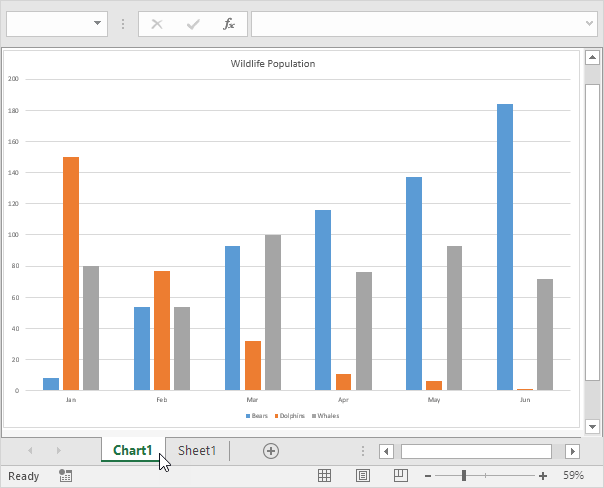
Creating charts from your Excel data can transform complex information into visually appealing and easily understandable diagrams. Whether you're a student, a business analyst, or just someone interested in data presentation, these easy steps will guide you through the process of making dynamic charts in Excel:
Step 1: Prepare Your Data

Before diving into chart creation, ensure your data is clean and well-organized:
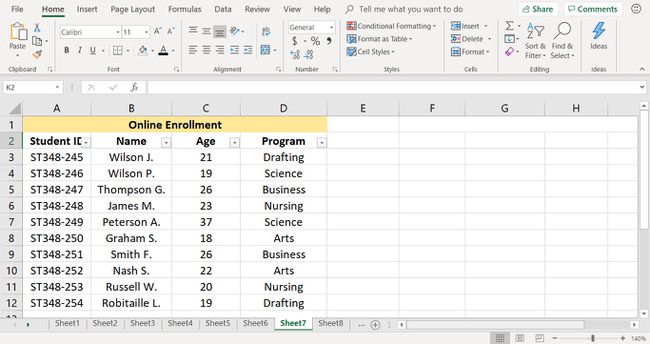
- Arrange your data in columns or rows where each column represents a series or category, and each row is a data point.
- Exclude any empty rows or columns within the range of data you wish to chart.
- Ensure there are no merged cells, as they can cause issues in charting.
📝 Note: Always verify the data integrity by checking for hidden rows or columns which might skew your chart.
Step 2: Select Your Data

To create a chart:
- Click on any cell within your data set or manually select the entire range you want to chart.
- If your data has headers, include them in the selection for automatic labeling.
Step 3: Insert the Chart

Once your data is selected:
- Go to the "Insert" tab on the Ribbon.
- Choose the desired chart type from the "Charts" section. Popular options include Column, Line, Pie, and Bar charts.
- Click on the specific chart type, and Excel will automatically generate a preview in your worksheet.
🔍 Note: If you're unsure which chart type to use, hover over each chart icon for a tooltip explaining its best uses.
Step 4: Customize Your Chart

After inserting the chart, you can customize it to better suit your needs:
- Use the "Chart Design" and "Format" tabs to alter the chart's layout, color scheme, style, and more.
- Adjust the legend, title, axis labels, and gridlines from the "Chart Tools" toolbar.
- Add chart elements like data labels or trendlines for additional clarity.
| Chart Element | Where to Find | Description |
|---|---|---|
| Title | Layout tab > Add Chart Element > Chart Title | Give your chart a descriptive name. |
| Legend | Layout tab > Add Chart Element > Legend | Explain what each data series represents. |
| Data Labels | Layout tab > Add Chart Element > Data Labels | Display the value of each data point directly on the chart. |

Step 5: Fine-Tune and Analyze

Your chart is now created, but you might want to:
- Reshape your chart by resizing the chart area or editing data points.
- Update Data: If your source data changes, right-click the chart and choose "Edit Data" to refresh it.
- Create Pivot Charts: For dynamic data analysis, convert your data into a pivot table and create a pivot chart.
To wrap up, creating charts in Excel not only helps in making sense of data but also enables you to share insights effectively. By following these steps, you'll be able to visualize data trends, compare values, and reveal patterns or anomalies that might otherwise go unnoticed. With practice, you'll become adept at choosing the right chart type for your data, thereby making your presentations or reports more compelling and insightful.
What is the difference between a Line Chart and a Column Chart?

+
A Line Chart is best for showing trends over time, while a Column Chart excels at comparing the size of categories or values at a specific point in time.
How can I make my chart dynamic as new data is added?

+
Use an Excel Table to house your data. Excel charts linked to tables will automatically update as you add or remove data from the table.
Is it possible to create a chart from multiple data sets?

+
Yes, you can include multiple data sets in one chart. Use the “Select Data” feature to add more data series to your existing chart.