How To Learn Excel Sheet
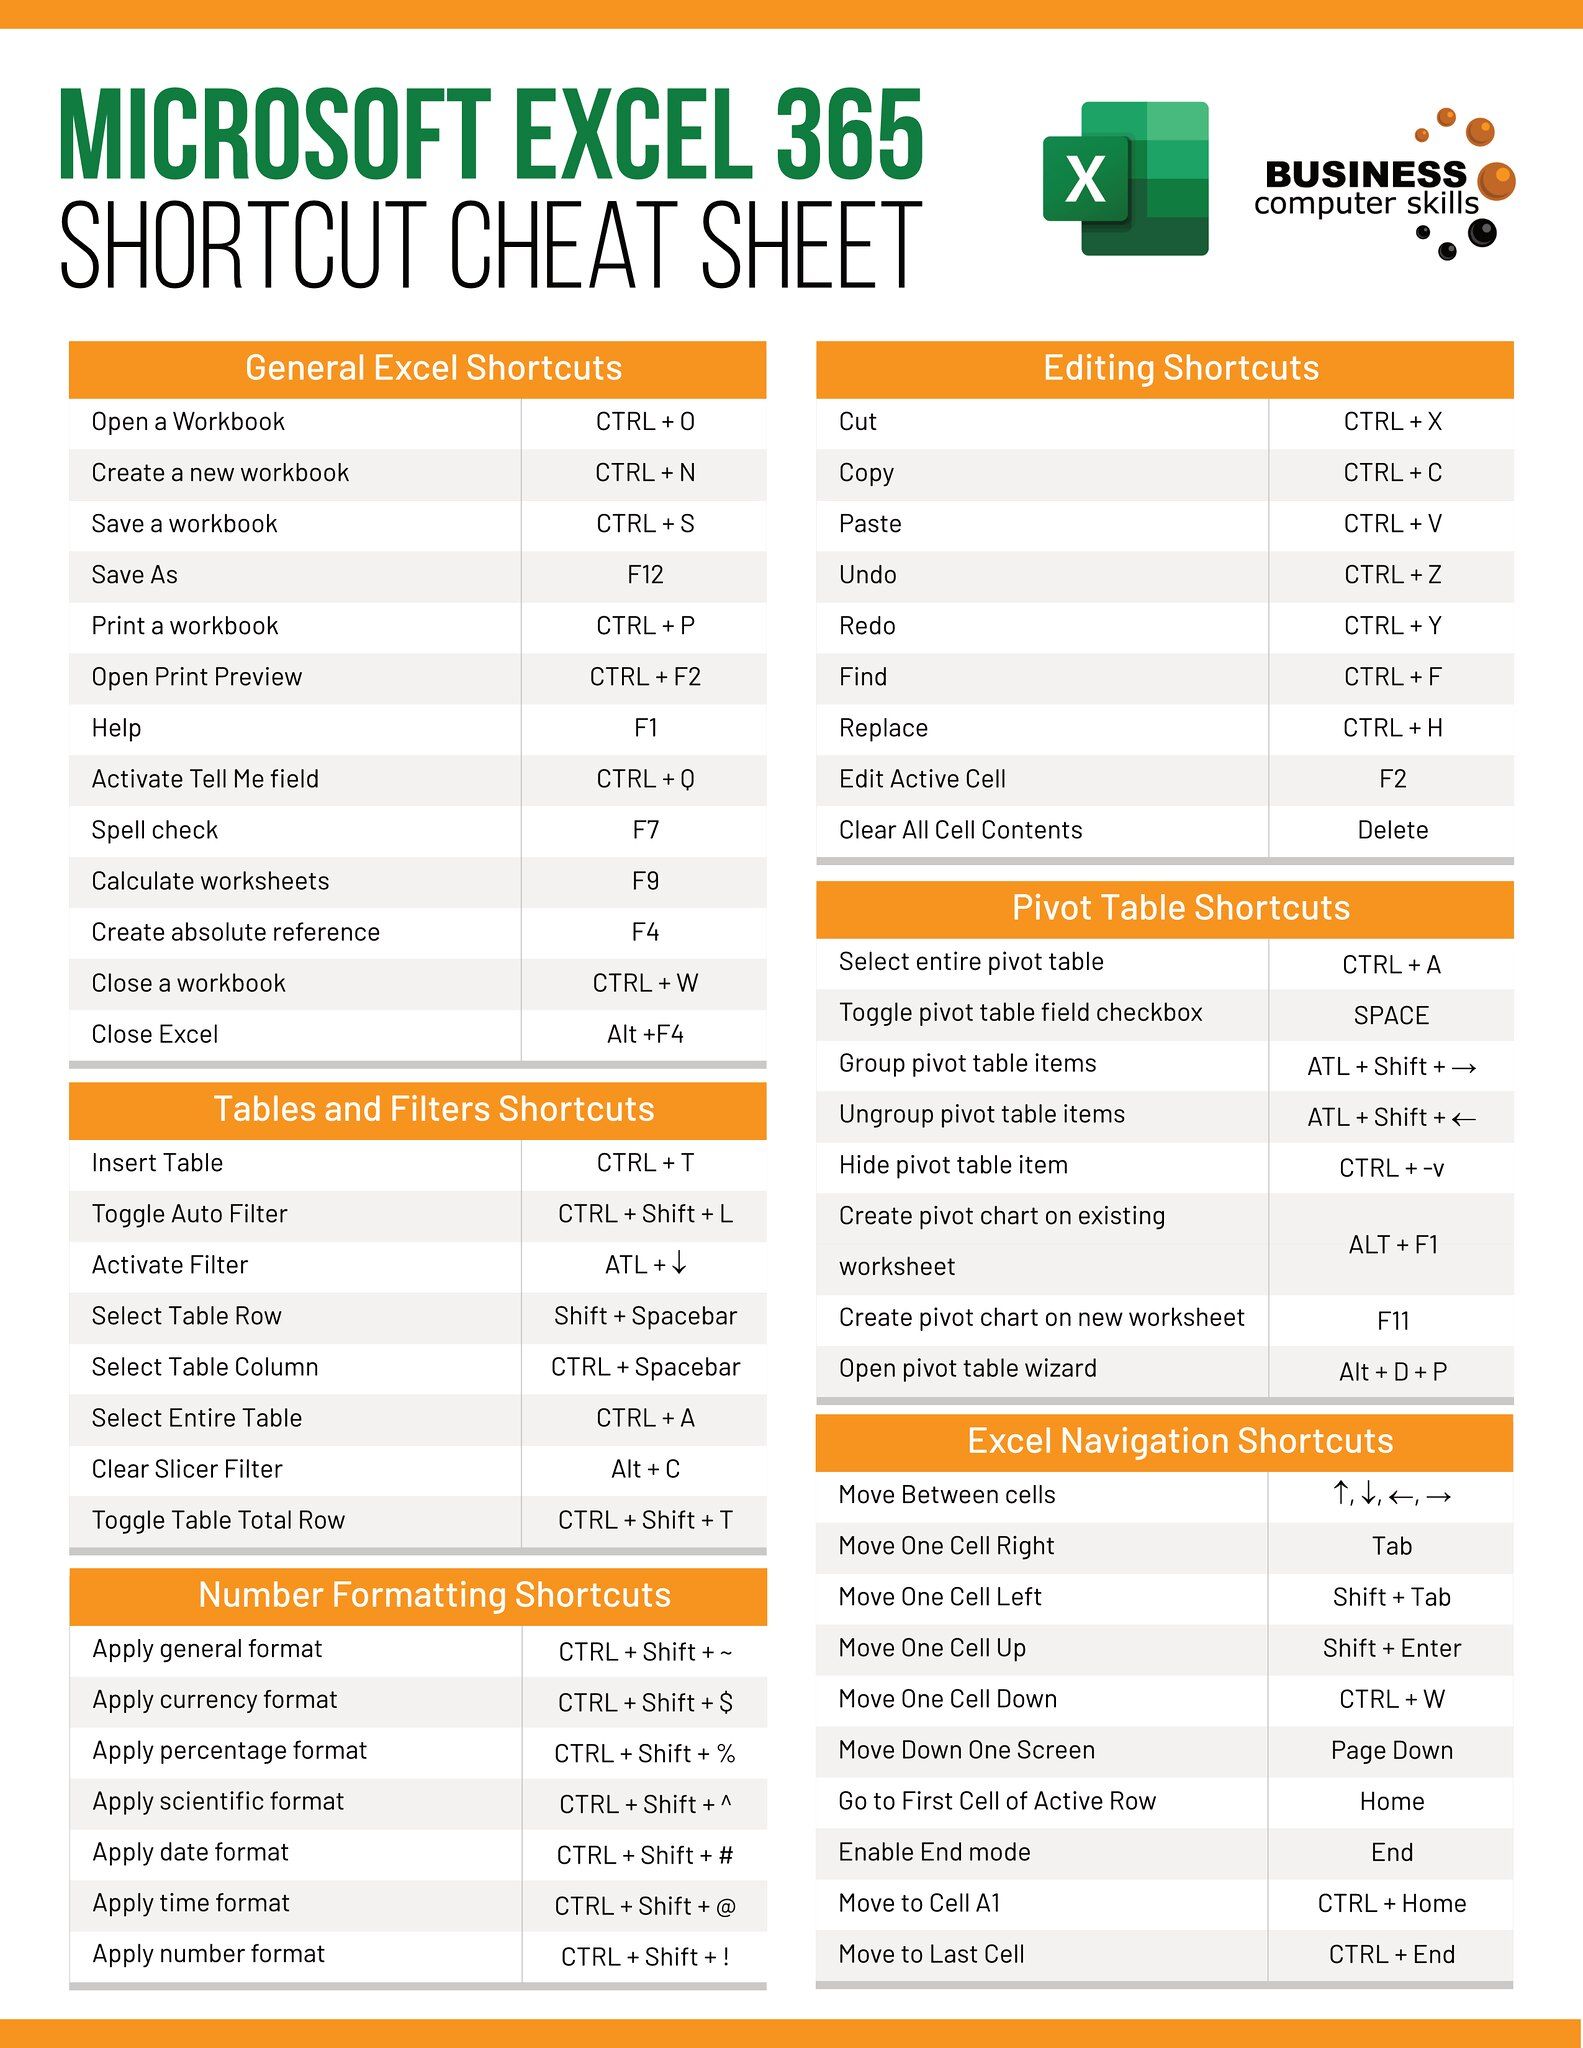
Learning Microsoft Excel can transform your productivity, whether you're managing personal finances or handling complex data analysis at work. Excel, known for its powerful capabilities in data management, calculation, and graphical representation, remains an indispensable tool in today's digital era. Let's dive into a comprehensive guide on how to learn Excel from the basics to advanced levels.
Getting Started with Excel

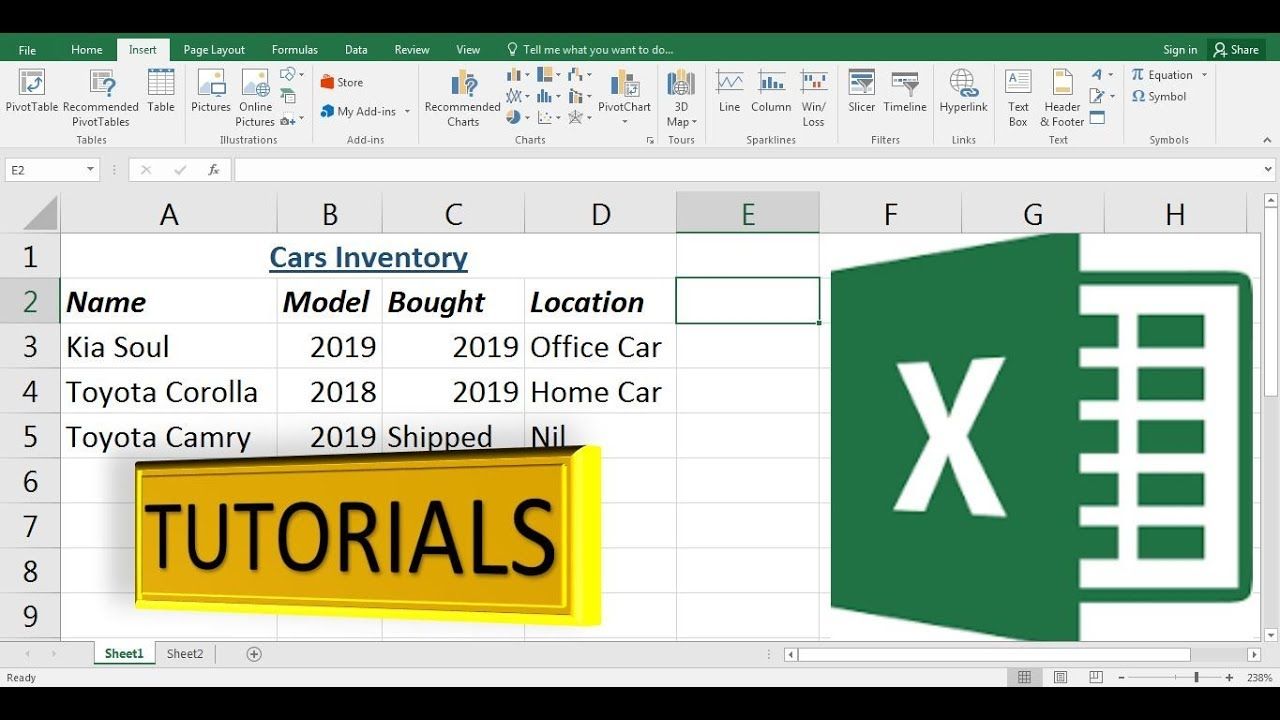
When you first open Excel, you'll encounter a grid of cells, where:
- Rows are identified by numbers.
- Columns are labeled with letters.
Navigating the Interface
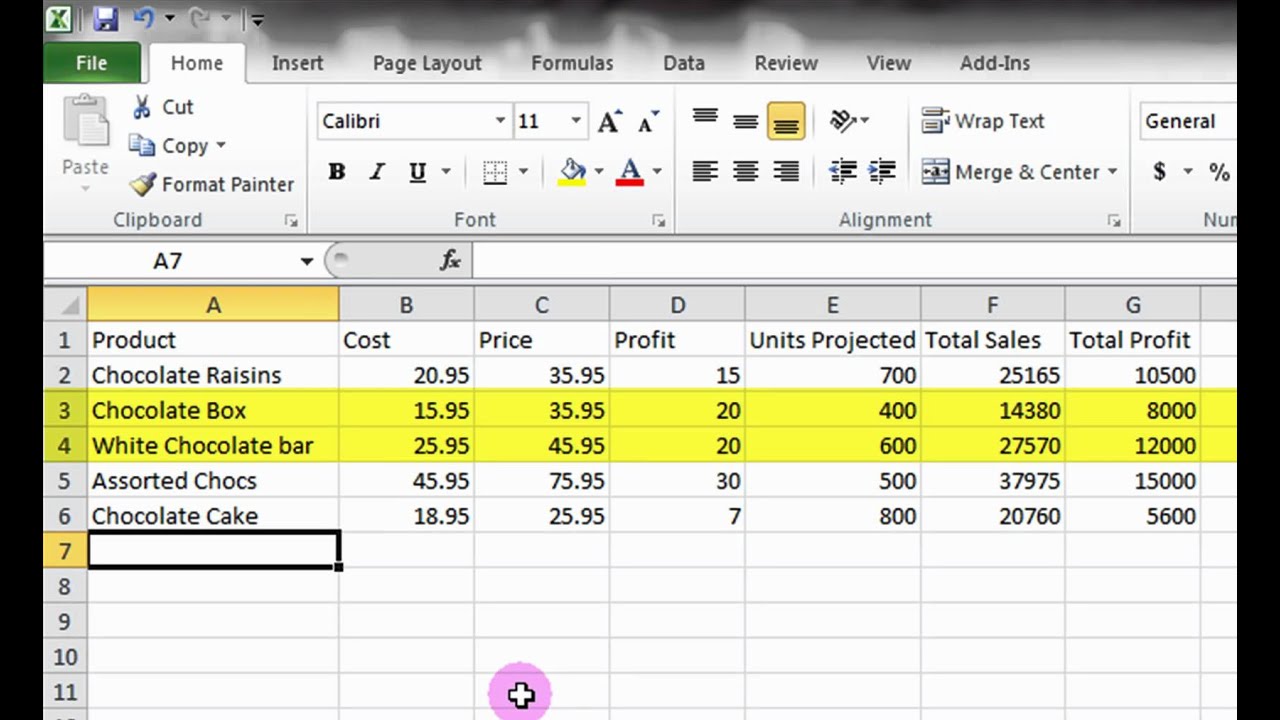
- Ribbon: The top bar containing tabs like Home, Insert, Page Layout, etc.
- Formula Bar: Used for entering and editing formulas.
- Name Box: Shows the current cell reference.
- Worksheets: Tabs at the bottom allowing multiple sheets in one file.
Your first step is to familiarize yourself with this interface:
- Spend time clicking around to understand what each section does.
- Try moving around using arrow keys, mouse, or touch if you have a touchscreen device.
Entering Data
- Click on a cell and start typing. Press Enter or Tab to move to the next cell.
- Use the mouse to select multiple cells to enter data or formulas quickly.
Basic Formulas and Functions

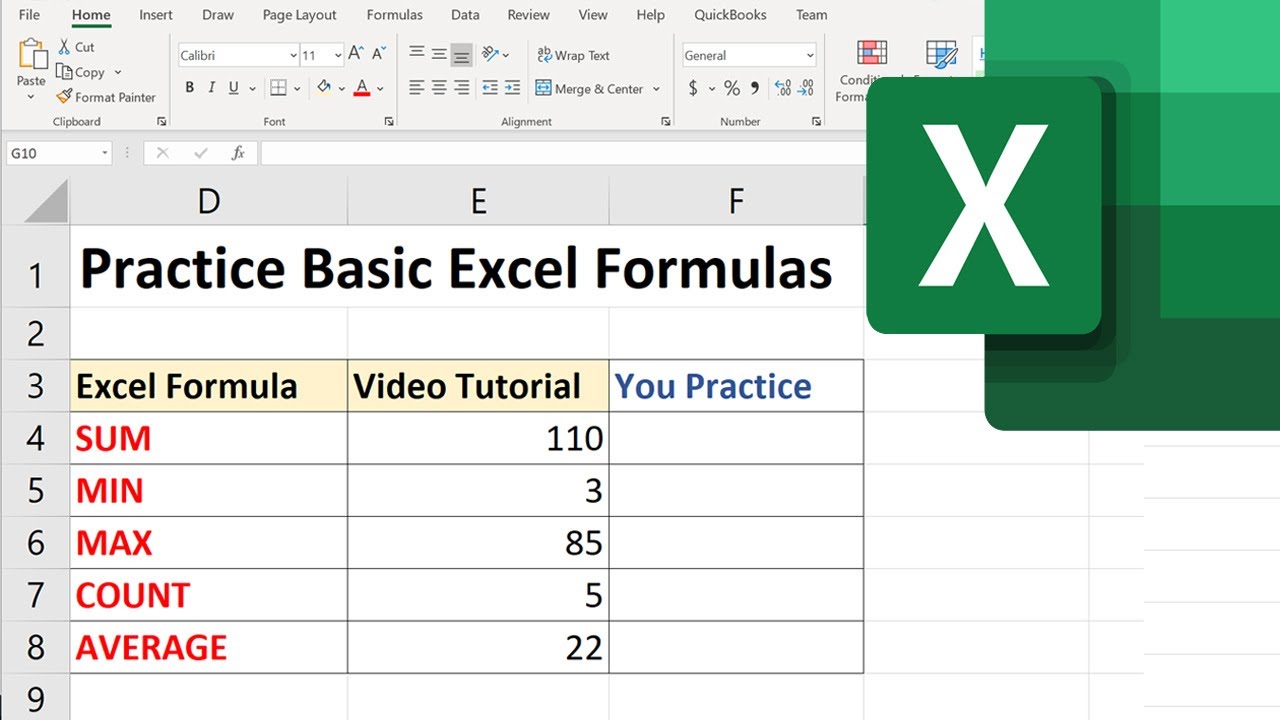
Excel shines with its formula capabilities. Here are some basic formulas to start with:
- SUM: Adds all numbers in a range. Example:
=SUM(A1:A10) - AVERAGE: Calculates the mean of numbers in a range. Example:
=AVERAGE(B1:B10) - MIN/MAX: Finds the smallest or largest number in a range. Example:
=MIN(C1:C10)
Mastering Excel Functions
As you progress, functions become your allies in data manipulation:
VLOOKUP, HLOOKUP

These functions are crucial for looking up and retrieving data from one column or row to another:
- VLOOKUP: Searches for a value in the leftmost column and returns a value from the same row. Example:
=VLOOKUP(A2, B2:D10, 3, FALSE) - HLOOKUP: Searches for a value in the top row and returns a value from the same column.
INDEX and MATCH

These functions are more versatile than VLOOKUP, allowing for lookups with flexible conditions:
- INDEX: Returns the value at a specified row and column in a range.
- MATCH: Searches for a specified item in a range of cells and then returns the relative position of that item.
Conditional Functions
Excel offers conditional functions like IF, COUNTIF, SUMIF:
- IF: Performs logical tests and returns a value based on the result.
- COUNTIF: Counts the number of cells that meet a certain condition.
- SUMIF: Sums cells that meet specific criteria.
📝 Note: Mastering these functions can significantly speed up data analysis and manipulation tasks.
Data Analysis Tools

Sorting and Filtering
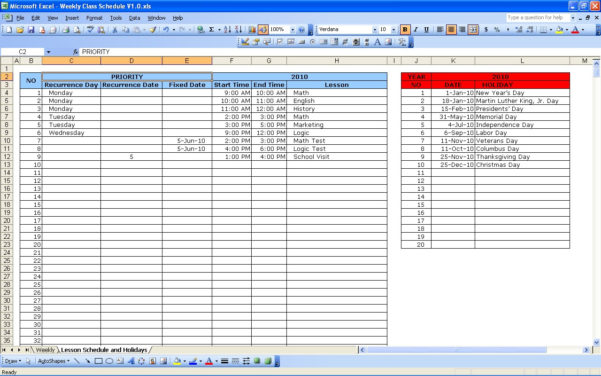
- Sorting: Arrange data in ascending or descending order by selecting a column and using the Sort feature.
- Filtering: Show only the data that meets certain criteria by clicking the filter button on a column header.
Data Tables

Excel’s Data Table feature lets you analyze how changing one or two variables affects the results of a formula:
- Set up your variables and results in a structured table.
- Use the What-If Analysis tools to see different outcomes based on your input changes.
PivotTables
PivotTables are dynamic tools for summarizing and reorganizing your data:
- Select your data, go to the Insert tab, and choose PivotTable.
- Drag fields into Rows, Columns, Values, or Filters to pivot your data instantly.
🔍 Note: PivotTables can initially seem daunting, but they are one of the most powerful features for data analysis.
Advanced Excel Techniques

Macros
Automate repetitive tasks with macros:
- Record a macro by performing tasks you want to automate.
- Edit the VBA (Visual Basic for Applications) code to customize or enhance the macro’s functionality.
Power Query
Power Query is excellent for data transformation and preparation:
- Import data from various sources.
- Clean, reshape, and merge data using an intuitive GUI.
Data Visualization
Excel isn’t just about numbers; it’s also about presenting them:
- Charts: Create various chart types like Bar, Pie, Line, and more.
- Conditional Formatting: Visually highlight data based on rules.
| Feature | Usage | Level |
|---|---|---|
| Formula Auditing | Trace how formulas are linked and errors in calculations | Intermediate |
| Array Formulas | Perform multiple calculations on one or more items in an array | Advanced |
| Name Manager | Define names for ranges or constants to simplify formulas | Intermediate |
In summary, becoming proficient in Excel can unlock your potential in data analysis, reporting, and productivity. From basic data entry to complex analysis with tools like Power Query, your journey with Excel is not just about learning formulas and functions but understanding data in ways that can enhance decision-making processes and streamline tasks. The key is to practice regularly, experiment with data, and explore all Excel has to offer.
What are the best online resources to learn Excel?
+Online platforms like Coursera, Udemy, LinkedIn Learning, and ExcelJet offer comprehensive courses from beginners to advanced levels.
How long does it take to learn Excel?
+The time can vary based on your learning goals and dedication. Basic proficiency might take a few weeks, while mastery could take months or even years of regular use and learning.
Can I use Excel for data analysis?
+Absolutely. Excel provides robust tools like PivotTables, advanced functions, and even integration with Power BI for in-depth data analysis.