5 Simple Ways to Insert Chart Sheets in Excel

Working with spreadsheets, especially in a versatile tool like Microsoft Excel, often requires the integration of charts to visually represent data. Whether you're a business analyst, a student, or a financial planner, knowing how to insert and manage chart sheets effectively can significantly enhance your data presentation. Here are five simple ways to insert chart sheets in Excel, each with its unique benefits and use-cases.
Method 1: Using the Insert Tab

The most straightforward method to add a chart sheet in Excel is through the Insert tab:
- Select the data range you wish to chart.
- Go to the Insert tab on the Ribbon.
- Choose the chart type from the 'Charts' group. Click on the dropdown arrow to see more options if necessary.
- After selecting a chart type, a mini chart will appear on your worksheet. If you want to move this chart to its own sheet:
- Click on the chart to activate its menu options.
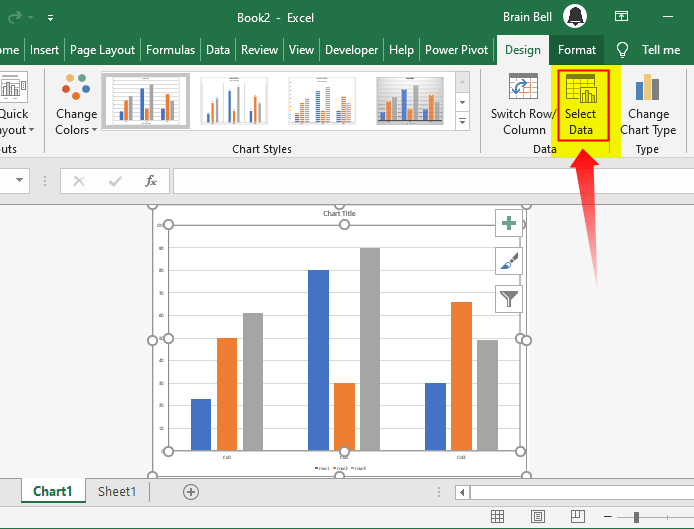
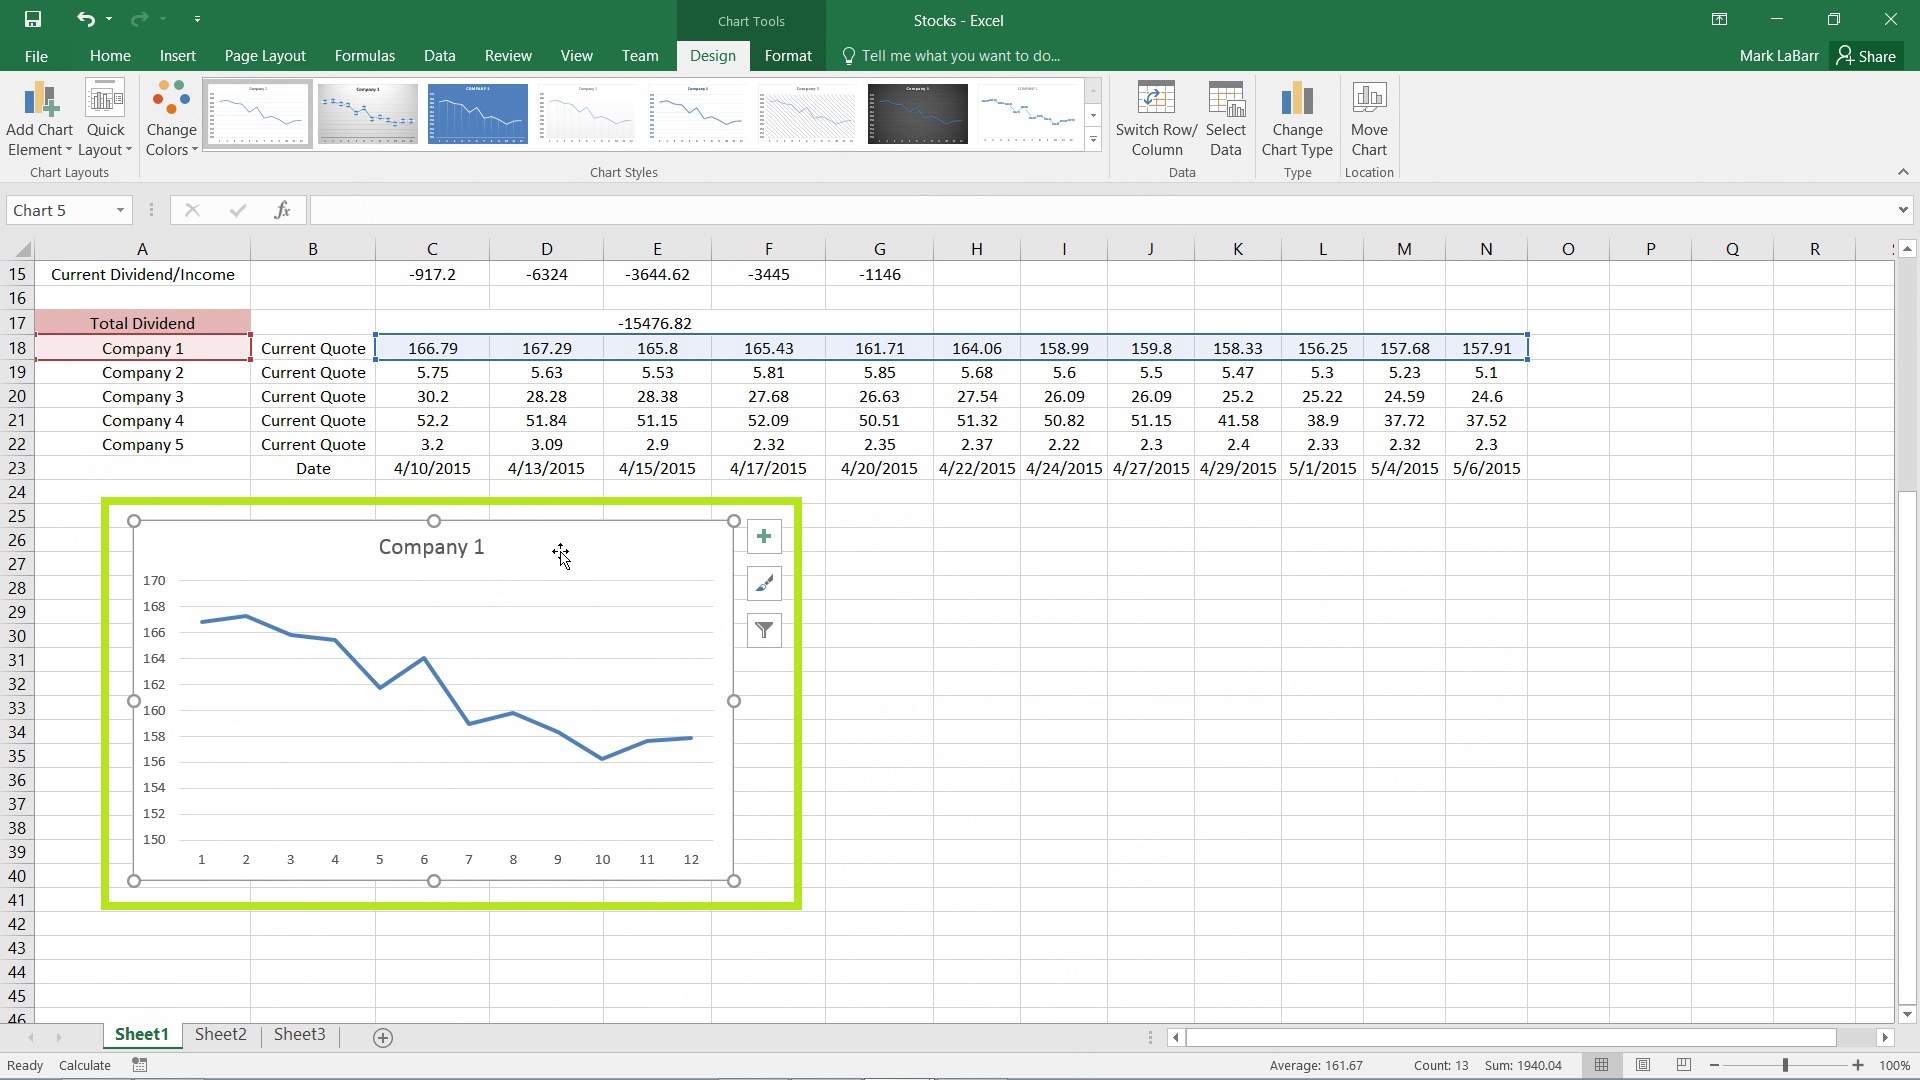
- Choose Move Chart from the 'Chart Tools Design' tab that appears when you click on the chart.
- In the Move Chart dialog box, select New sheet and optionally name the sheet.
- Click OK.
📌 Note: Make sure you have your data selected before inserting the chart, as Excel will use this data to generate the chart.
Method 2: Using Quick Analysis Tool

If you prefer a quick and efficient way to insert charts:
- Highlight your data range.
- Look for the Quick Analysis button that appears at the bottom-right corner of your selection.
- Hover over the Charts icon in the Quick Analysis menu.
- Select the chart type you wish to create.
- Right-click on the chart and choose Move Chart. Then, select New sheet and confirm with OK.
Method 3: Keyboard Shortcuts

For users who prefer keyboard shortcuts for speed:
- Select your data.
- Press Alt + F1 to insert a default chart directly into your worksheet.
- With the chart selected, press Alt + J and then H for Chart Tools Design.
- Press M to Move Chart, and N to select New Sheet.
- Press Enter to confirm.
Method 4: VBA Macro

For those comfortable with VBA (Visual Basic for Applications), here's how you can automate chart creation:
- Press Alt + F11 to open the VBA editor.
- Insert a new module: Insert > Module.
- Copy and paste the following code: ```vba Sub AddChartSheet() Dim myChart As Chart Set myChart = Charts.Add With myChart .SetSourceData Sheets("Sheet1").Range("A1:C10") .Name = "Data Chart" .ChartType = xlColumnClustered End With End Sub ```
- Modify the range and chart type to match your data and preference.
- Close the VBA editor and press Alt + F8 to run the macro.
Method 5: Using the 'Recommended Charts' Feature

Excel’s 'Recommended Charts' can suggest charts based on your data:
- Select your data.
- Go to the Insert tab, click on Recommended Charts.
- Preview the suggested charts, and select one that suits your needs.
- Once the chart appears, right-click and choose Move Chart, then select New sheet**.
In summary, these methods provide different pathways to achieve the same goal of inserting a chart into a new sheet in Excel. Each approach has its advantages, from speed (using shortcuts) to automation (using VBA) or simplicity (using the insert tab). Understanding these methods not only enhances your productivity but also allows for more dynamic and visually appealing data presentations.
What’s the difference between embedding a chart in a worksheet vs. creating a chart sheet?

+
When you embed a chart in a worksheet, it sits alongside your data, which can be useful for quick references. However, a chart sheet provides a dedicated space for the chart, offering more room for customization and better visibility, especially for presentations.
Can I change the type of chart after inserting it?

+
Yes, you can modify the chart type at any time. Click on the chart, go to the ‘Chart Tools Design’ tab, and select ‘Change Chart Type’ to choose a different chart type.
Is it possible to link data between sheets with a chart?

+
Absolutely! Excel charts can link to data from different sheets or even different workbooks. This allows for dynamic updates when the source data changes.