Insert Chart on New Sheet in Excel for Mac

Managing data in Microsoft Excel is an essential skill for both personal and professional use. On a Mac, Excel provides a variety of features that make organizing and analyzing data not only efficient but also intuitive. One such feature is the ability to insert a chart on a new sheet. This functionality allows users to separate the visual representation of their data from the raw data itself, making it easier to present and analyze information.
Why Insert Charts on a New Sheet?

When dealing with extensive datasets, it's beneficial to:
- Reduce clutter in your workbook by segregating visual representations from raw data.
- Enhance presentation for meetings or reports where data visualization is key.
- Enable easier navigation through your data workbook.
- Allow for better sharing options where only the visual insights are necessary.
Steps to Insert a Chart on a New Sheet in Excel for Mac

1. Selecting Data for Your Chart

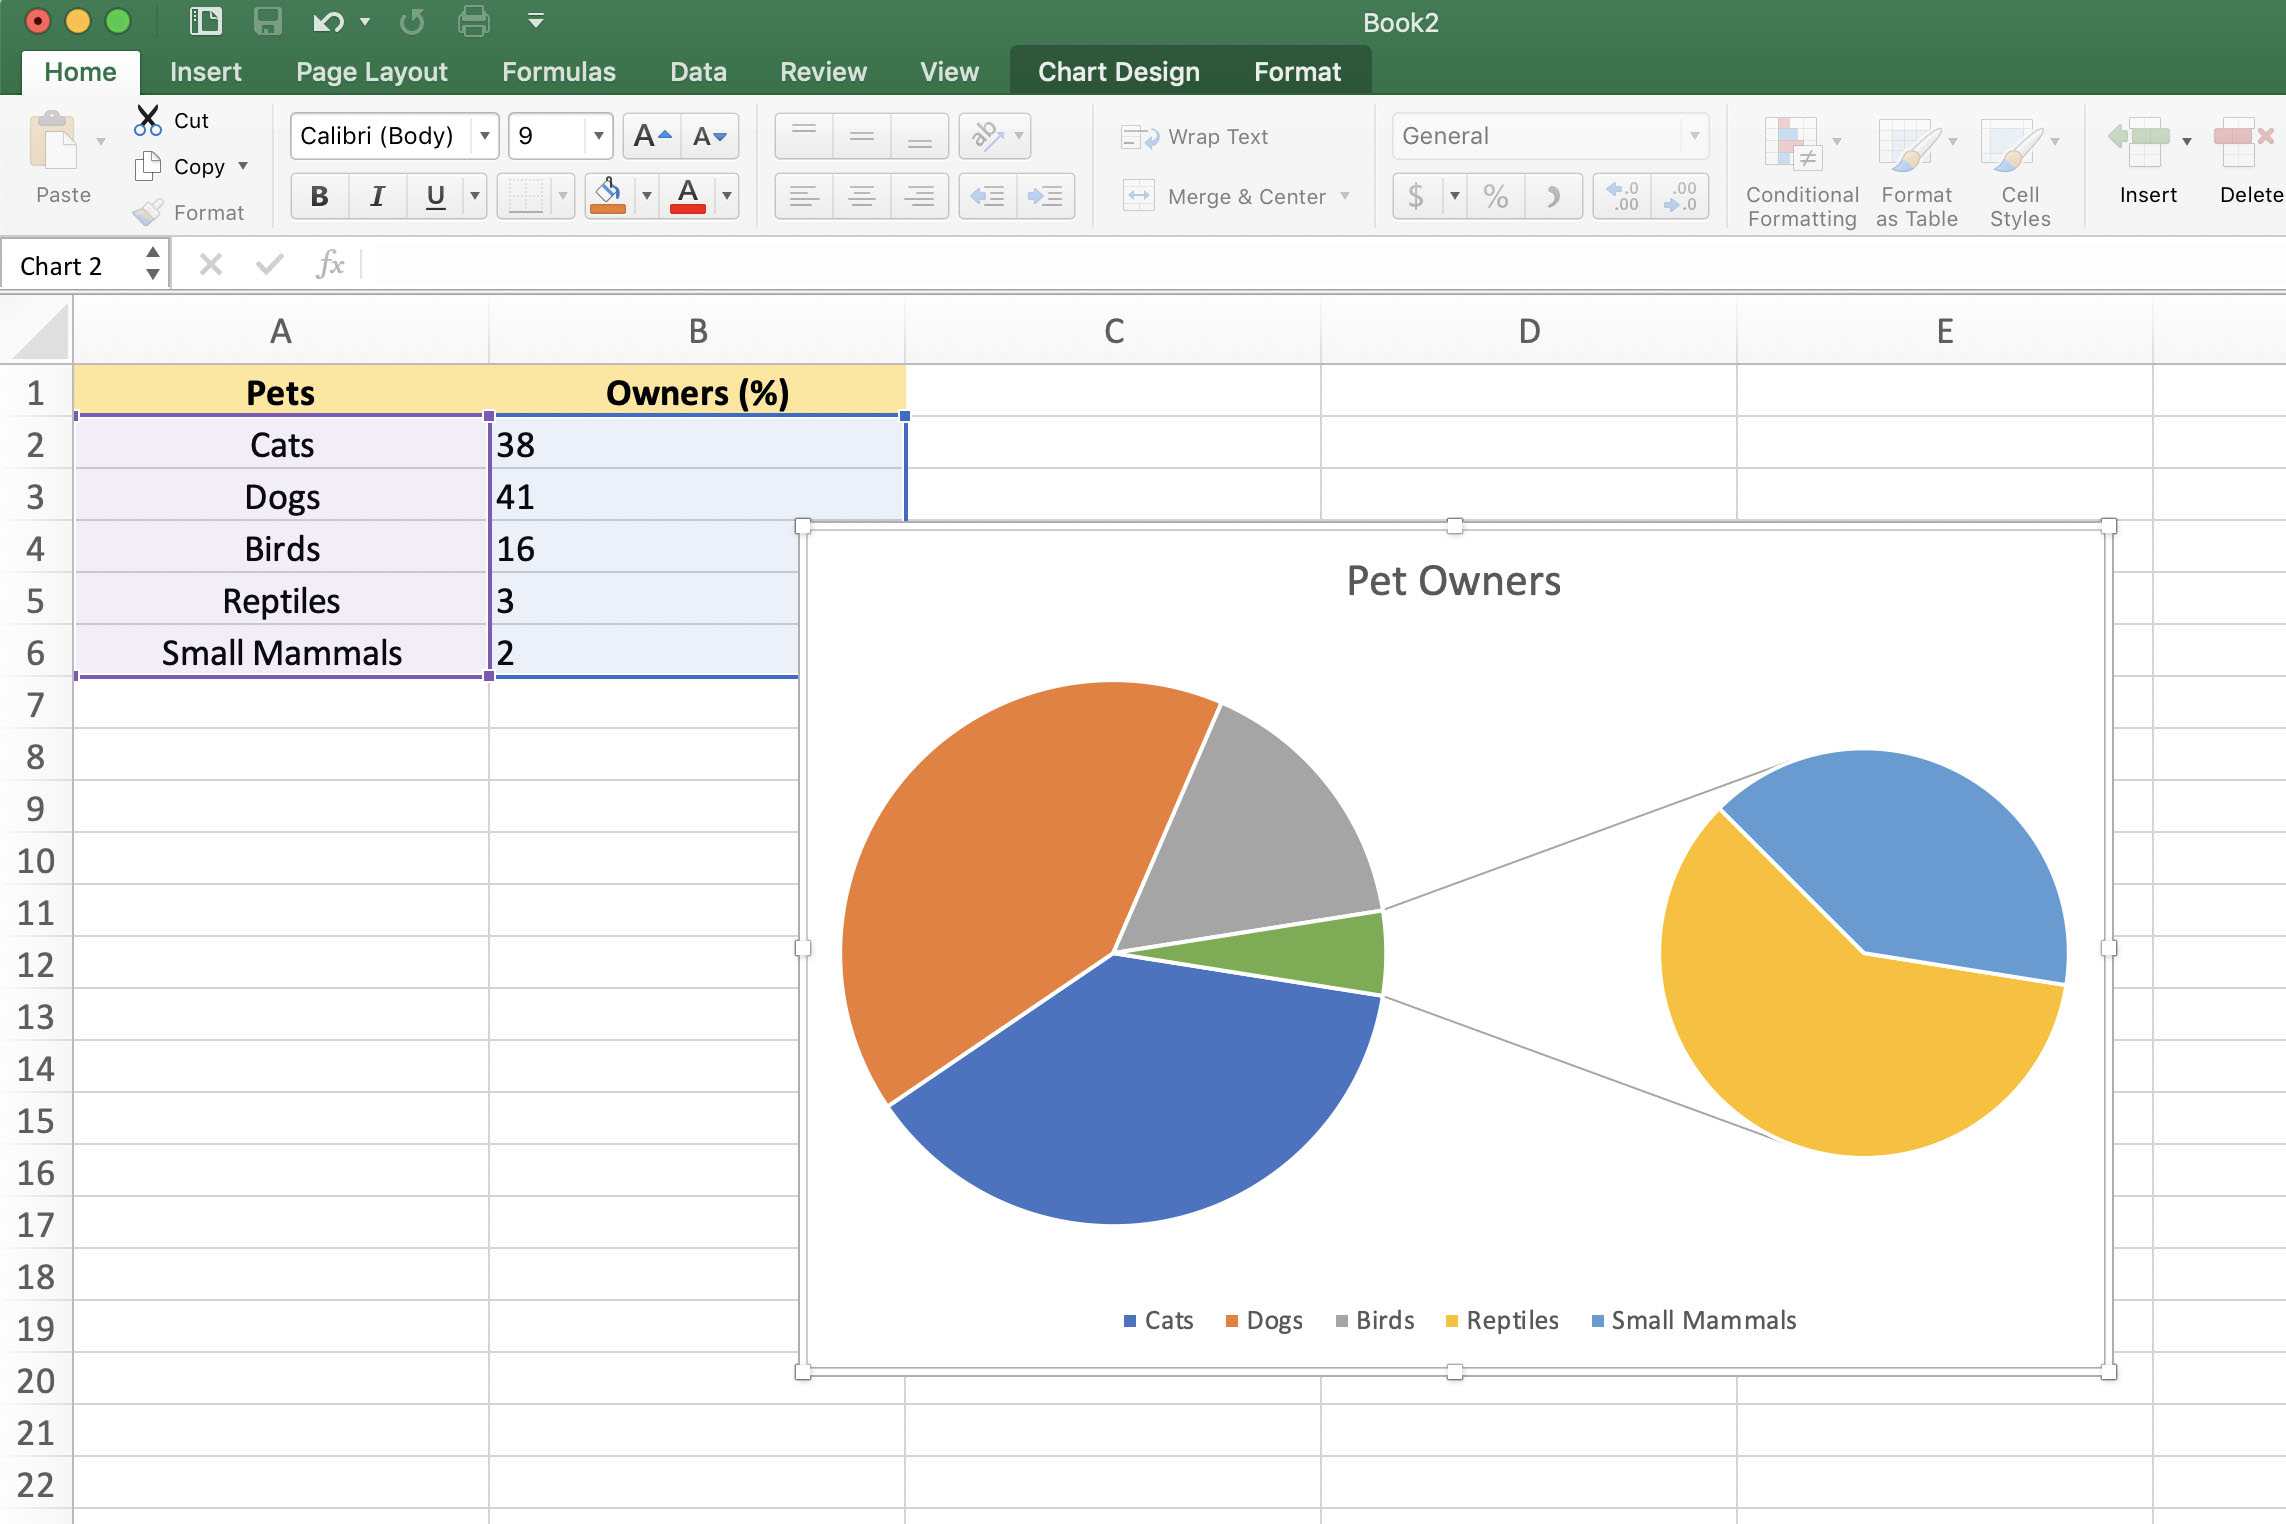
Begin by highlighting the cells containing the data you wish to chart:
- Method 1: Click on the top-left cell and drag to the bottom-right cell.
- Method 2: Hold down Shift and click on the last cell in the range.
2. Creating the Chart

With the data selected:
- Click on the Insert tab at the top of Excel.
- Choose from various chart types like Column, Line, Pie, etc., or use the Recommended Charts feature for suggestions based on your data.
3. Moving the Chart to a New Sheet

Once your chart appears on the worksheet:
- Right-click (or control-click) on the chart to open the context menu.
- Select Move Chart.
- In the Move Chart dialogue box, choose New Sheet and provide a name for the new sheet where the chart will reside.
- Click OK.
Your chart will now be placed on a separate worksheet for better organization and clarity.
4. Customizing Your Chart

With the chart on its new sheet, you can further:
- Adjust the chart title, axis labels, and data labels from the Chart Elements button on the chart.
- Use the Chart Design and Format tabs to change the chart style, colors, and layout.
- Right-click on specific chart elements for more detailed customization options.
Key Considerations

When creating charts, keep these points in mind:
- Ensure your data is correctly formatted for accurate representation.
- Choose a chart type that best illustrates the nature of your data.
- Always review the chart for clarity and effectiveness in conveying the intended message.
💡 Note: Make sure to select the correct range of data before inserting your chart. Selecting the wrong range can result in an incorrect chart.
In summary, inserting a chart on a new sheet in Excel for Mac can significantly improve your data management and presentation capabilities. This feature allows you to keep your data and charts well-organized, making it easier to navigate, present, and analyze information. By following these steps, you can effectively leverage Excel's charting capabilities to enhance your data analysis process.
Can I insert multiple charts into one new sheet in Excel?

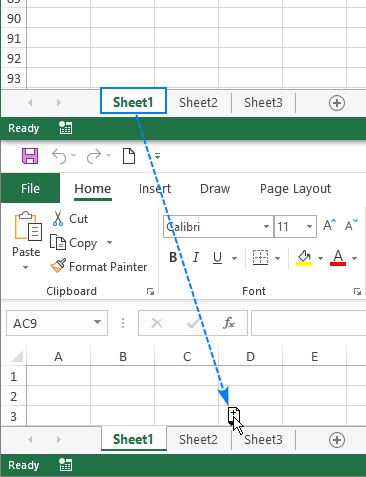
+Yes, you can insert multiple charts on a single new sheet. Simply repeat the process for each chart you want to create, and choose the same new sheet when moving the chart.
What’s the benefit of using a new sheet for charts?

+Using a new sheet for charts helps in keeping your workbook organized, reduces clutter on the main data sheets, and makes presentations cleaner and more focused on visual insights.
How do I update the chart if the data changes?

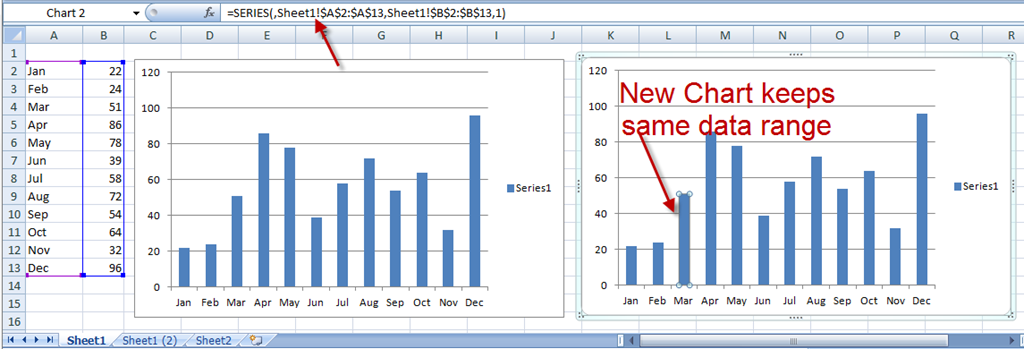
+If you update the original data, the chart will automatically reflect these changes as long as the data source remains the same. However, if you have moved the chart to a new sheet, ensure the chart’s data range is correctly linked to the original data.