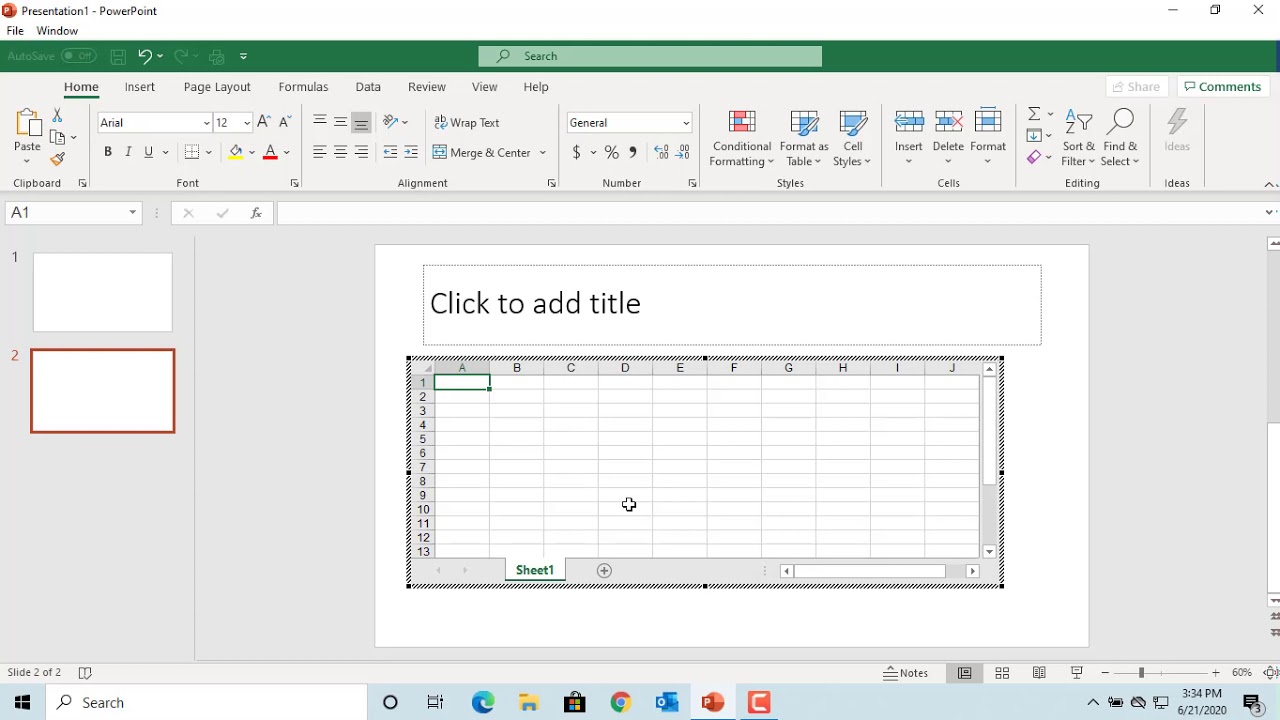
5 Easy Ways to Embed Excel Sheets in PowerPoint Presentations

Embedding Excel Sheets in PowerPoint: A Comprehensive Guide

Merging the intricate details of spreadsheets with the visual prowess of PowerPoint can greatly enhance your presentation, offering audiences a clearer understanding of complex data. Here are five straightforward methods to embed Excel sheets in PowerPoint presentations:
1. Copy and Paste as Picture

This method is best for a static snapshot of your data.
- Open your Excel spreadsheet and select the cells or chart you want to insert into PowerPoint.
- Copy (Ctrl + C or Cmd + C) the selection.
- Go to your PowerPoint slide, click where you want to place the image, and paste it as a picture by choosing ‘Paste Options’ and selecting ‘Picture’.
💡 Note: Pasting as a picture means any changes in Excel won’t update in PowerPoint.
2. Object Embedding

This approach allows for live editing and data synchronization.
- On the PowerPoint slide, select where you want to embed the Excel object.
- Go to the ‘Insert’ tab, choose ‘Object’, and then ‘Create from file’.
- Browse to your Excel file, select it, and check the box for ‘Link’ if you want the presentation to automatically update with changes made to the Excel file.
- Once inserted, you can double-click the object to edit it directly within PowerPoint.
3. Inserting a Chart

PowerPoint can import Excel charts while maintaining a connection for dynamic updates.
- In PowerPoint, under ‘Insert’, select ‘Chart’. This opens Excel within PowerPoint.
- Edit the chart as needed, and any changes you make will reflect on your slide.
- If you want to link back to an existing chart in your Excel file:
- Open the Excel file, copy the chart.
- In PowerPoint, paste the chart and choose ‘Use Destination Theme & Link Data’.
💡 Note: For linked charts, ensure the data source remains in the same location or adjust links accordingly.
4. Table Insertion

When you need to showcase tabular data, this method works well:
- In Excel, select the table or a range of cells you wish to embed.
- Copy the selection and in PowerPoint, go to the ‘Home’ tab and click ‘Paste Special’.
- Choose ‘Microsoft Excel Worksheet Object’ for full functionality or ‘Picture (Enhanced Metafile)’ for a static image.
5. Dynamic Range Embedding

Use this for only updating specific ranges of an Excel sheet in your presentation:
- In Excel, name the range of cells you want to embed by selecting it, going to the ‘Formulas’ tab, choosing ‘Name Manager’, and adding a new range name.
- Copy the named range.
- In PowerPoint, on the slide where you want the data, select ‘Home’ > ‘Paste Special’ and choose ‘Microsoft Excel Worksheet Object’.
The integration of Excel and PowerPoint data provides an enhanced way to deliver detailed information in a visual context. By employing any of the above methods, you can ensure that your data remains accurate and up-to-date, making your presentation not only visually appealing but also dynamically engaging.
Why should I link instead of embedding Excel data?

+
Linking allows for automatic updates if the Excel data changes. Embedding does not update automatically, but linking can result in larger file sizes due to the need to maintain the connection to the source.
How can I ensure my PowerPoint presentation remains current with Excel data?
+
To keep your presentation up-to-date, use the ‘Object’ embedding with the link option or insert charts with the ‘Link’ feature enabled. If your Excel file location changes, you’ll need to update the links manually.
Can I edit an embedded Excel object in PowerPoint?

+
Yes, you can double-click on an embedded Excel object in PowerPoint to open it for editing. However, changes made here won’t affect the original Excel file unless you’ve linked it.