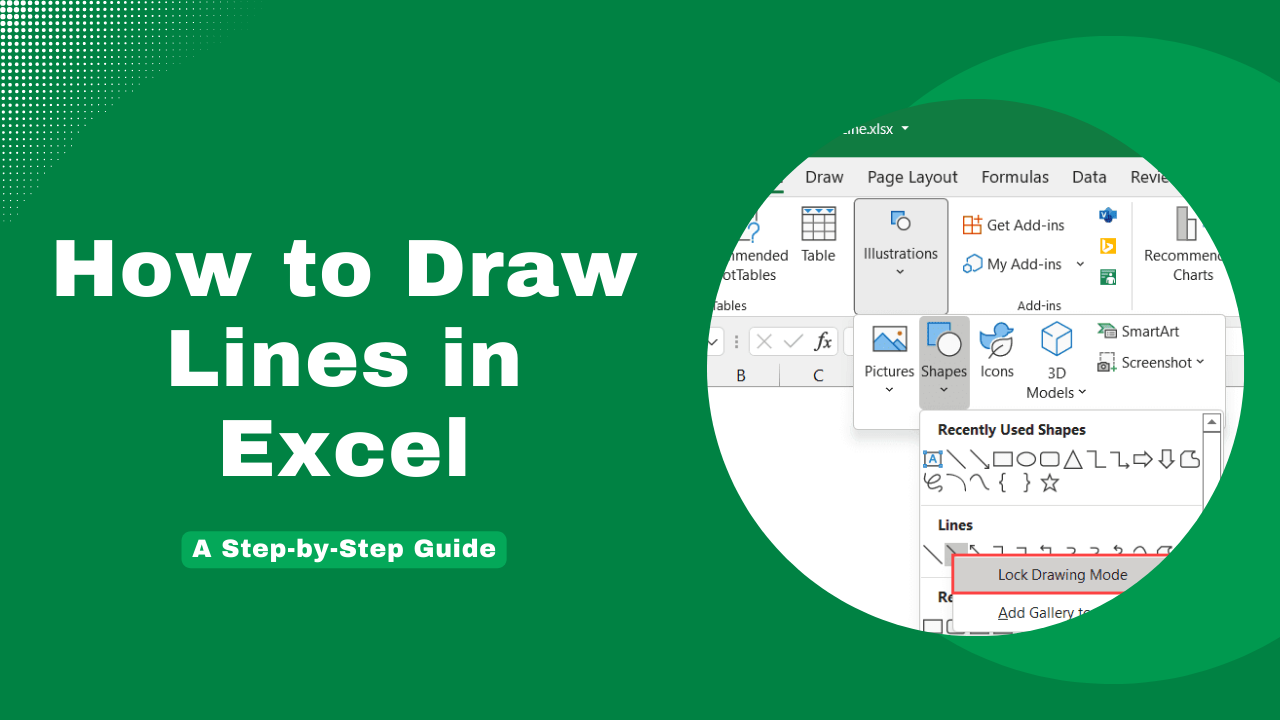
5 Easy Ways to Insert Lines in Excel Sheet

In Microsoft Excel, inserting lines isn't just about aesthetics; it plays a crucial role in organizing and analyzing data effectively. Whether you're enhancing readability, highlighting critical data points, or simply making your spreadsheets look more professional, knowing how to add lines in Excel can significantly improve your data management skills. Here are five straightforward methods to insert lines in your Excel sheets, each tailored to different needs and purposes.
1. Adding Borders

Borders are one of the simplest ways to define boundaries around cells, which can be done in various styles:
- Select Cells: Choose the cells where you want to add borders.
- Access Borders: Go to the Home tab on the Ribbon. In the Font group, find the ‘Borders’ drop-down.
- Choose Style: Select from predefined border styles like ‘Outside Borders’, ‘Thick Box Border’, or ‘All Borders’.
- Custom Borders: If you need specific borders, click on ‘More Borders…’ to open the Format Cells dialog. Here, you can manually select each side or corner of the cell to apply borders.
📌 Note: Remember, borders can be applied to multiple cells at once, but they do not change the data or merge cells.
2. Gridlines

Gridlines are faint lines that outline every cell in your spreadsheet:
- Show/Hide: Go to File > Options > Advanced, and under Display options for this worksheet, toggle ‘Show gridlines’ on or off.
- Color Change: Under Gridline color, choose a new color from the palette. This change will apply to the whole workbook.
3. Inserting Line Graphs

When dealing with data trends or progress tracking, line graphs are an excellent visual aid:
- Select Data: Choose the range of cells containing your data.
- Insert Graph: Navigate to the Insert tab, click on ‘Line’ or ‘Line with Markers’ in the Charts group.
- Customize: Use the Chart Tools that appear to modify the appearance of your line graph, including line thickness, color, and style.
4. Using Sparklines

Sparklines are mini charts within cells that show trends in a concise manner:
- Select Cell: Decide where you want your sparkline to appear.
- Add Sparkline: From the Insert tab, select ‘Line’ in the Sparklines group.
- Data Range: Specify the data range you want to plot and choose the line style from the options provided.
While sparklines can represent basic trends, they won’t replace detailed data analysis.
5. Conditional Formatting

This method allows you to apply lines based on specific data conditions:
- Select Data: Highlight the cells you wish to format.
- Open Formatting: Go to Home > Conditional Formatting.
- Choose Rule: Select ‘New Rule’ and choose a rule type such as ‘Use a formula to determine which cells to format’.
- Set Criteria: Enter a formula and in the ‘Format’ option, choose to add a border or fill color. For example, using a formula to highlight cells where values exceed a certain threshold.
📌 Note: Conditional formatting rules can be cumulative, meaning multiple formats can be applied to a single cell if conditions are met.
As we've explored, inserting lines in Excel isn't merely about decoration. These methods enhance the way you present, analyze, and interact with your data. From traditional borders to dynamic conditional formatting, Excel offers a toolkit to make your spreadsheets both functional and visually appealing. Your choice of method should depend on what you aim to achieve with your data visualization—whether it's clarity, emphasis, or a comprehensive overview of trends. Understanding these techniques will undoubtedly improve your Excel proficiency, making you adept at managing and presenting data in a compelling manner.
How do I remove lines in Excel?

+
To remove borders or lines, select the cells, go to the ‘Home’ tab, and under the ‘Borders’ option, select ‘No Border’. For gridlines, go to File > Options > Advanced and uncheck ‘Show gridlines’.
Can I change the color of the lines in Excel?

+
Yes, you can change the color of borders through the ‘Format Cells’ dialog or gridlines by selecting a different color under File > Options > Advanced. For line graphs or sparklines, use the chart formatting options to customize the color.
What’s the difference between borders and gridlines in Excel?

+
Borders are user-applied lines that define the edges of selected cells, making specific data stand out. Gridlines are the faint, default lines that separate all cells in the spreadsheet for better visibility and organization.


