Insert a Chart Sheet in Excel 2016 Easily

Managing and presenting data in a comprehensible and visually appealing format is a key feature of Microsoft Excel 2016. If you're looking to transform your complex datasets into clear insights, then creating chart sheets is your way to go. Chart sheets in Excel provide a dedicated space for your charts, away from the clutter of rows and columns of data.
Why Use Chart Sheets in Excel 2016?


- Improved Readability: Chart sheets make your charts the center of attention, allowing viewers to focus solely on the visual representation.
- Ease of Sharing: Exporting a chart as an image or PDF is simpler when it's on its own sheet.
- Enhanced Presentation: Presenting data in meetings or reports becomes more professional with a standalone chart.
Steps to Insert a Chart Sheet in Excel 2016

Inserting a chart sheet in Excel 2016 can be done with just a few clicks. Here’s how you can make your data shine:
1. Select Your Data

Before creating a chart, highlight the data you wish to include. This could be a range of cells or an entire table.
💡 Note: Ensure your data is organized logically for accurate chart representation.
2. Create the Chart

With your data selected:
- Navigate to the Insert tab on the Excel ribbon.
- Choose the chart type that best suits your data. You'll see options like Column, Line, Pie, Bar, and more.
- Click on your preferred chart type.
📊 Note: Consider the nature of your data to pick the most effective chart. For instance, use a pie chart for showing proportions or a column chart for comparing quantities.
3. Move the Chart to Its Own Sheet

After selecting your chart type, follow these steps:
- Right-click anywhere on the chart area.
- From the context menu, select Move Chart...
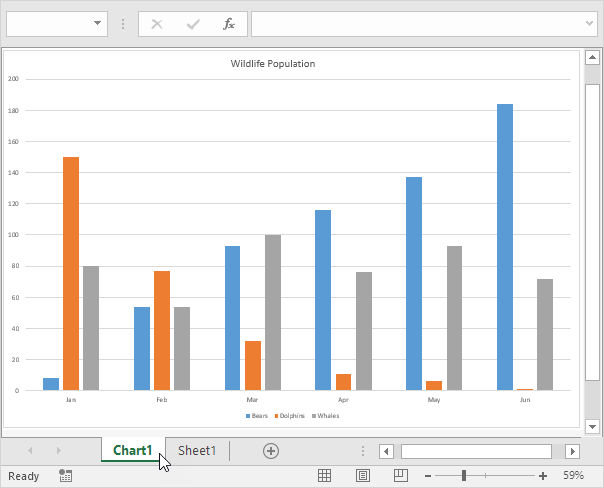
- In the Move Chart dialog box, choose New sheet and enter a name for your chart sheet.
- Click OK.
4. Customize Your Chart

Now that your chart is in its own sheet, you can:
- Adjust the chart title and add subtitles if needed.
- Modify axis labels and titles for clarity.
- Change chart elements like legends, gridlines, or data labels through the chart tools under the Design, Layout, and Format tabs.
- Tweak colors, styles, and font sizes to enhance visibility.
🎨 Note: Consistency in design and color schemes can make your charts more professional and cohesive.
Best Practices for Creating Chart Sheets

To make your chart sheets not only functional but also visually appealing, consider these tips:
- Keep It Simple: Avoid chart overload. Stick to one chart per sheet unless comparing closely related data sets.
- Clear Titles and Labels: Always include titles for the chart, axes, and data labels if necessary.
- Color Coding: Use colors to differentiate data sets or to highlight important points.
- Proportions Matter: Ensure your chart is not distorted, maintaining true representation of data.
- Consistent Formatting: If presenting multiple charts, maintain a consistent style for seamless viewing.
📈 Note: Use the chart filters to temporarily hide data series for a clearer presentation when necessary.
Chart sheets in Excel 2016 provide an excellent tool for data visualization, making your analysis and reporting more accessible to your audience. By isolating charts into their own sheets, you not only enhance the clarity of the information being presented but also make it easier to focus on the visual interpretation of your data. Whether you're preparing a business report, academic presentation, or just analyzing personal finances, understanding how to insert and customize chart sheets will certainly make your Excel experience more productive and your presentations more compelling.
Can I update the chart on the chart sheet if my data changes?

+
Yes, if your data source in Excel changes, the chart on the chart sheet will automatically update to reflect those changes.
Is it possible to create multiple charts on a single chart sheet?

+
Technically, yes, but it’s generally recommended to keep one chart per chart sheet for clarity. You can insert multiple charts within a worksheet if they’re related.
How do I print or export my chart sheet?

+
To print or export your chart sheet, you can select it and use Excel’s print function or save it as an image or PDF directly from the chart sheet.