Insert Chart Sheet in Excel 2010 Easily

Microsoft Excel 2010 provides a variety of chart types to visualize your data effectively. Learning how to insert a chart sheet in Excel can significantly enhance your data presentation and analysis capabilities. This guide will take you through the steps to insert and customize a chart sheet in Excel 2010, making your data more digestible and visually appealing.
What is a Chart Sheet?

Before we dive into the steps, it’s worth understanding what a chart sheet is. A chart sheet in Excel is a separate worksheet where you can display a chart full-screen, free from the clutter of other worksheet data. This focus on the chart allows for better visibility and easier chart manipulation.
Steps to Insert a Chart Sheet in Excel 2010

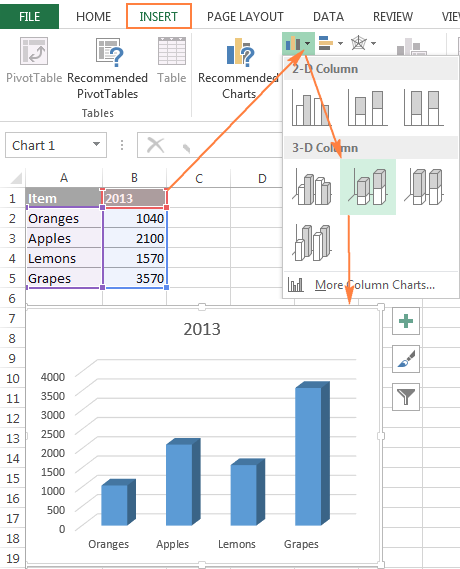
- Select Your Data: Start by selecting the data range you want to include in your chart. Remember, good data organization leads to better charts.
- Navigate to the Insert Tab: Once your data is selected, navigate to the Insert tab on the Excel Ribbon.
- Choose Your Chart Type: Click on the chart icon in the Charts group. A dialog box will appear where you can choose from various chart types like Column, Line, Pie, etc.
- Select a Chart Sub-type: After selecting a chart type, you’ll see several sub-types for that chart. Pick the one that best represents your data.
- Create the Chart: Click ‘OK’, and your chart will appear in your existing worksheet.
- Move Chart to Chart Sheet: To move your chart to a chart sheet:
- Right-click on the chart and choose ‘Move Chart’ from the context menu.
- In the ‘Move Chart’ dialog, select ‘New Sheet’ and optionally give it a name.
- Click ‘OK’, and your chart will now appear on a new chart sheet.
Customizing Your Chart Sheet

- Chart Layout and Style: Click on the chart to activate the Chart Tools, where you can adjust the layout, add titles, legend, data labels, etc., and change the chart style to better suit your data presentation needs.
- Changing Chart Type: If you decide later that the chart type isn’t suitable, you can change it from the ‘Chart Tools’ > ‘Design’ tab.
- Formatting: Use the ‘Format’ tab to alter the appearance of your chart further. Here, you can change colors, line styles, and even add special effects like shadows or glows.
- Data Modification: Any changes to the data range in the original worksheet will automatically reflect in your chart sheet. Remember to update your data for real-time chart updates.
Important Notes:

📝 Note: Moving a chart to a new sheet does not change the data source; it simply provides a full-page view of the chart.
🔍 Note: When updating data in the source worksheet, ensure you refresh your chart to see the latest data reflected in your chart sheet.
In summary, knowing how to insert and customize a chart sheet in Excel 2010 is a vital skill for anyone working with data. This process helps you not only visualize data but also present it in a manner that stands out. Keep practicing these steps, experiment with different chart types and customizations, and your Excel skills will grow immensely.
How do I change the data source for my chart sheet?

+
To change the data source, select your chart, go to the ‘Design’ tab under Chart Tools, and click on ‘Select Data’. Here, you can modify the data range or series for your chart.
Can I print a chart sheet in Excel 2010?

+
Yes, you can print your chart sheet directly. Navigate to the chart sheet, go to File > Print, and choose to print the current sheet to get a printout of just the chart.
What’s the benefit of using a chart sheet over placing charts in a worksheet?

+
A chart sheet offers a focused, full-page view of your chart, making it easier to study and analyze. It reduces clutter and distractions, enhancing readability and presentation quality.


